Liquidity Flow Detection
Follow the money. Not the crowd.
FlowEntry watches 600+ Binance pairs every minute for one-sided buying and selling. It marks the zone where it happened, then tracks every trade in public. Losses included.
Free to open. A short tour starts on your first visit.
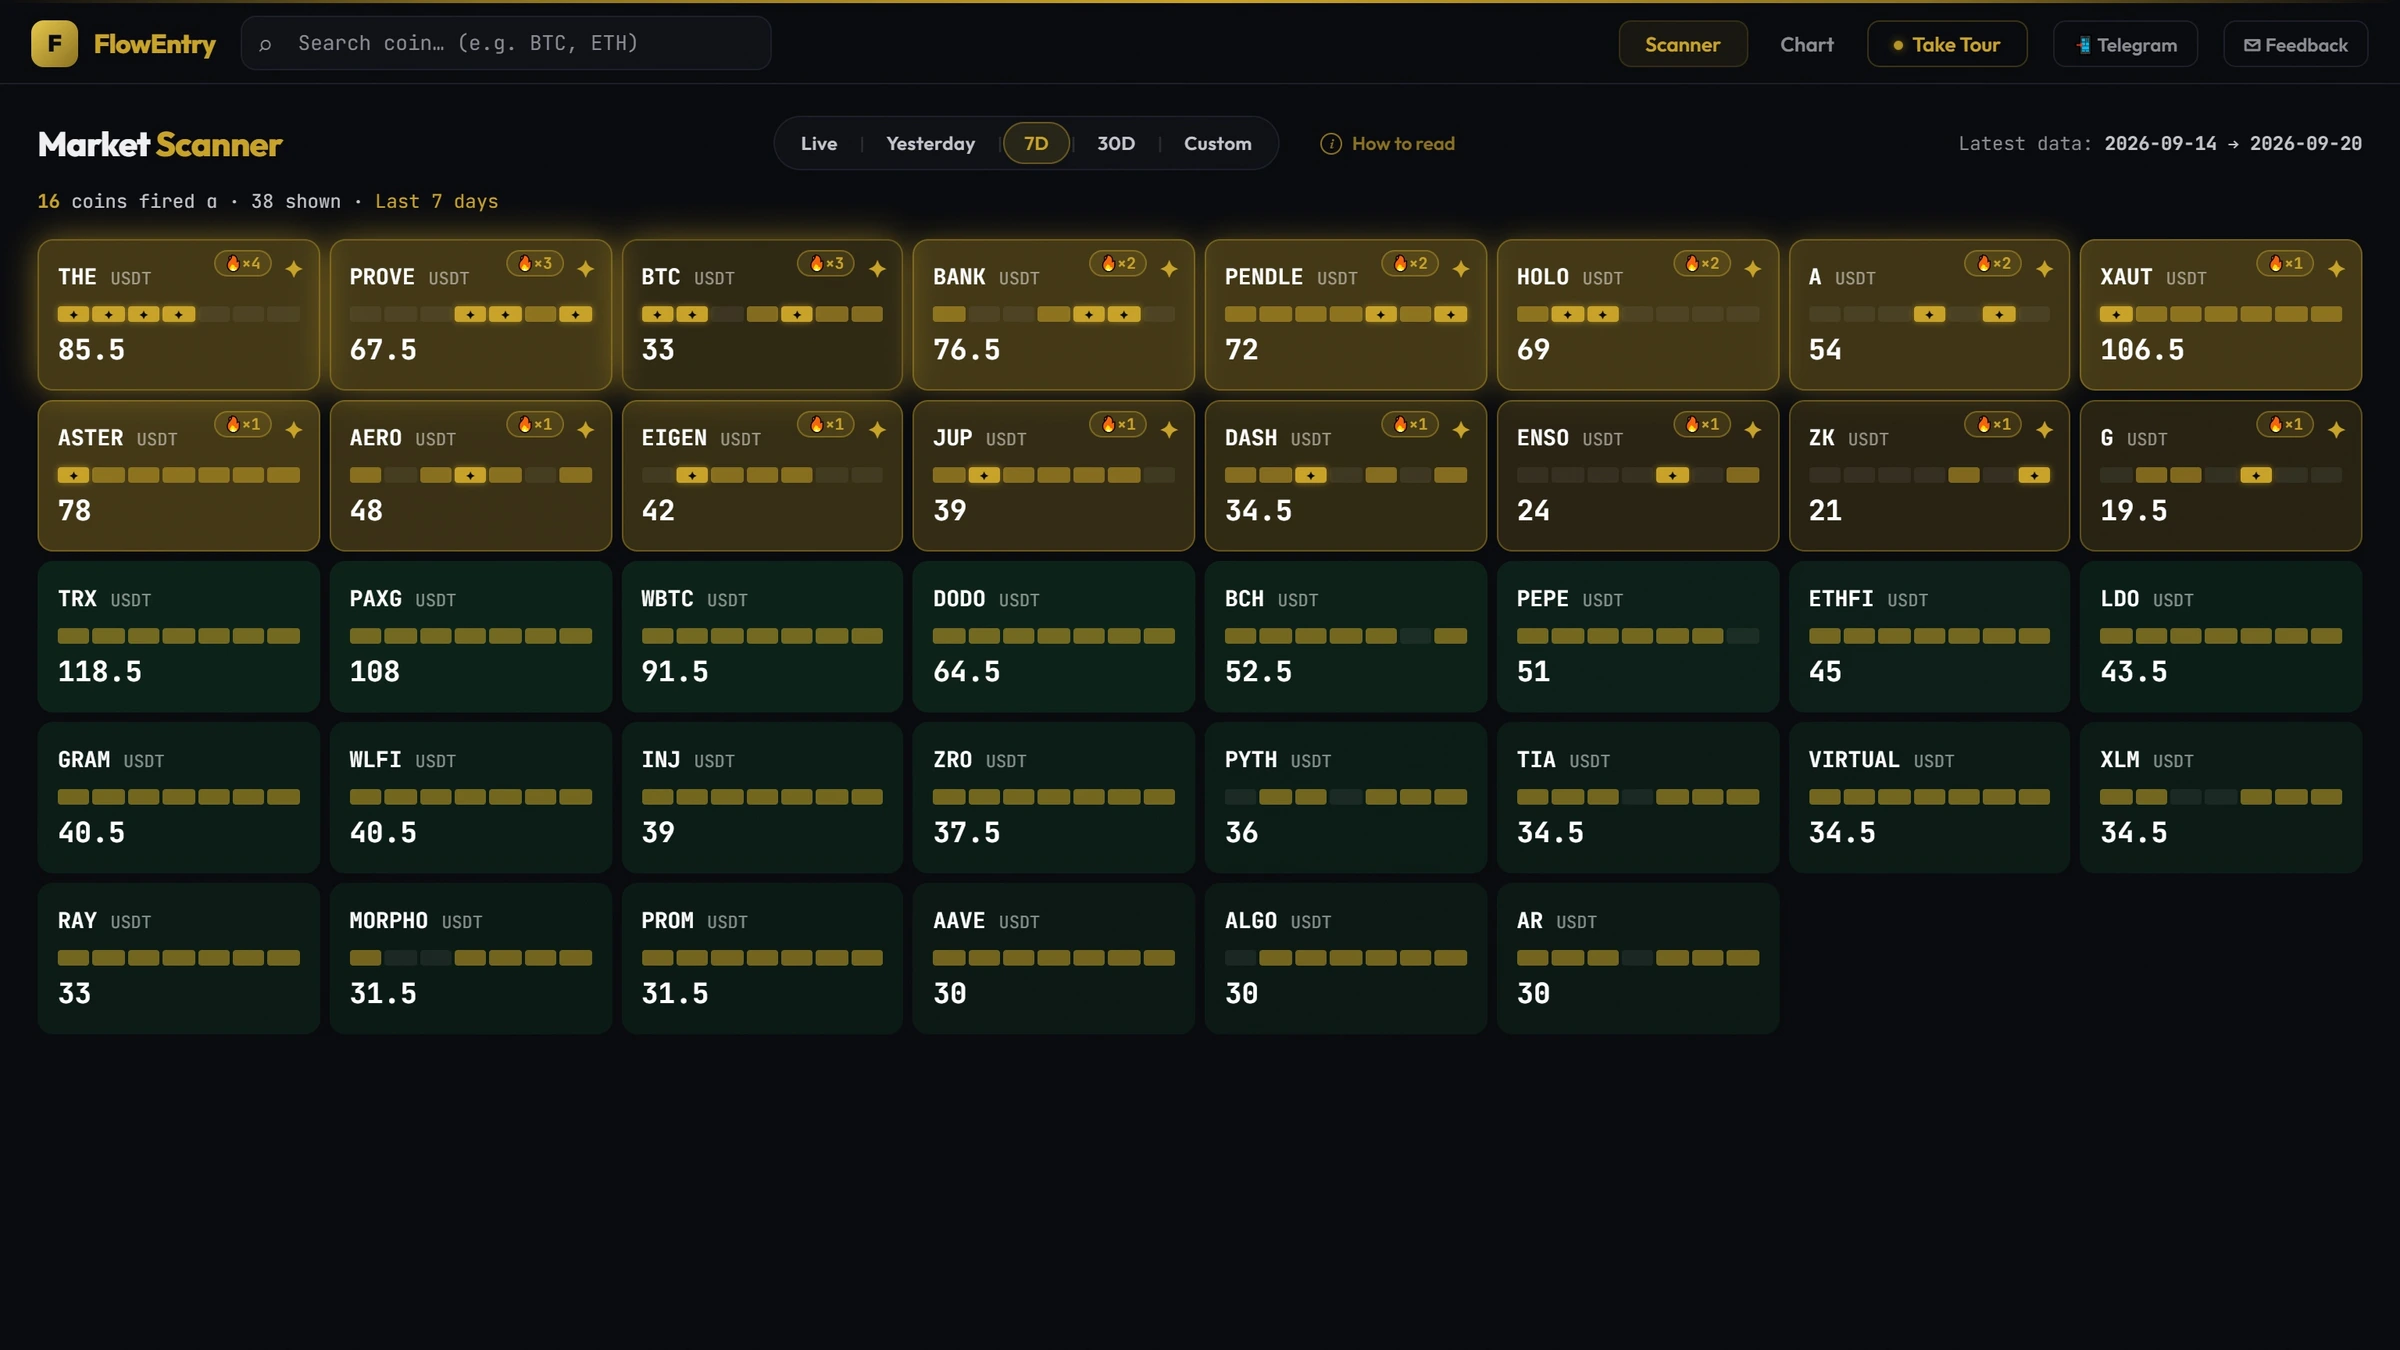
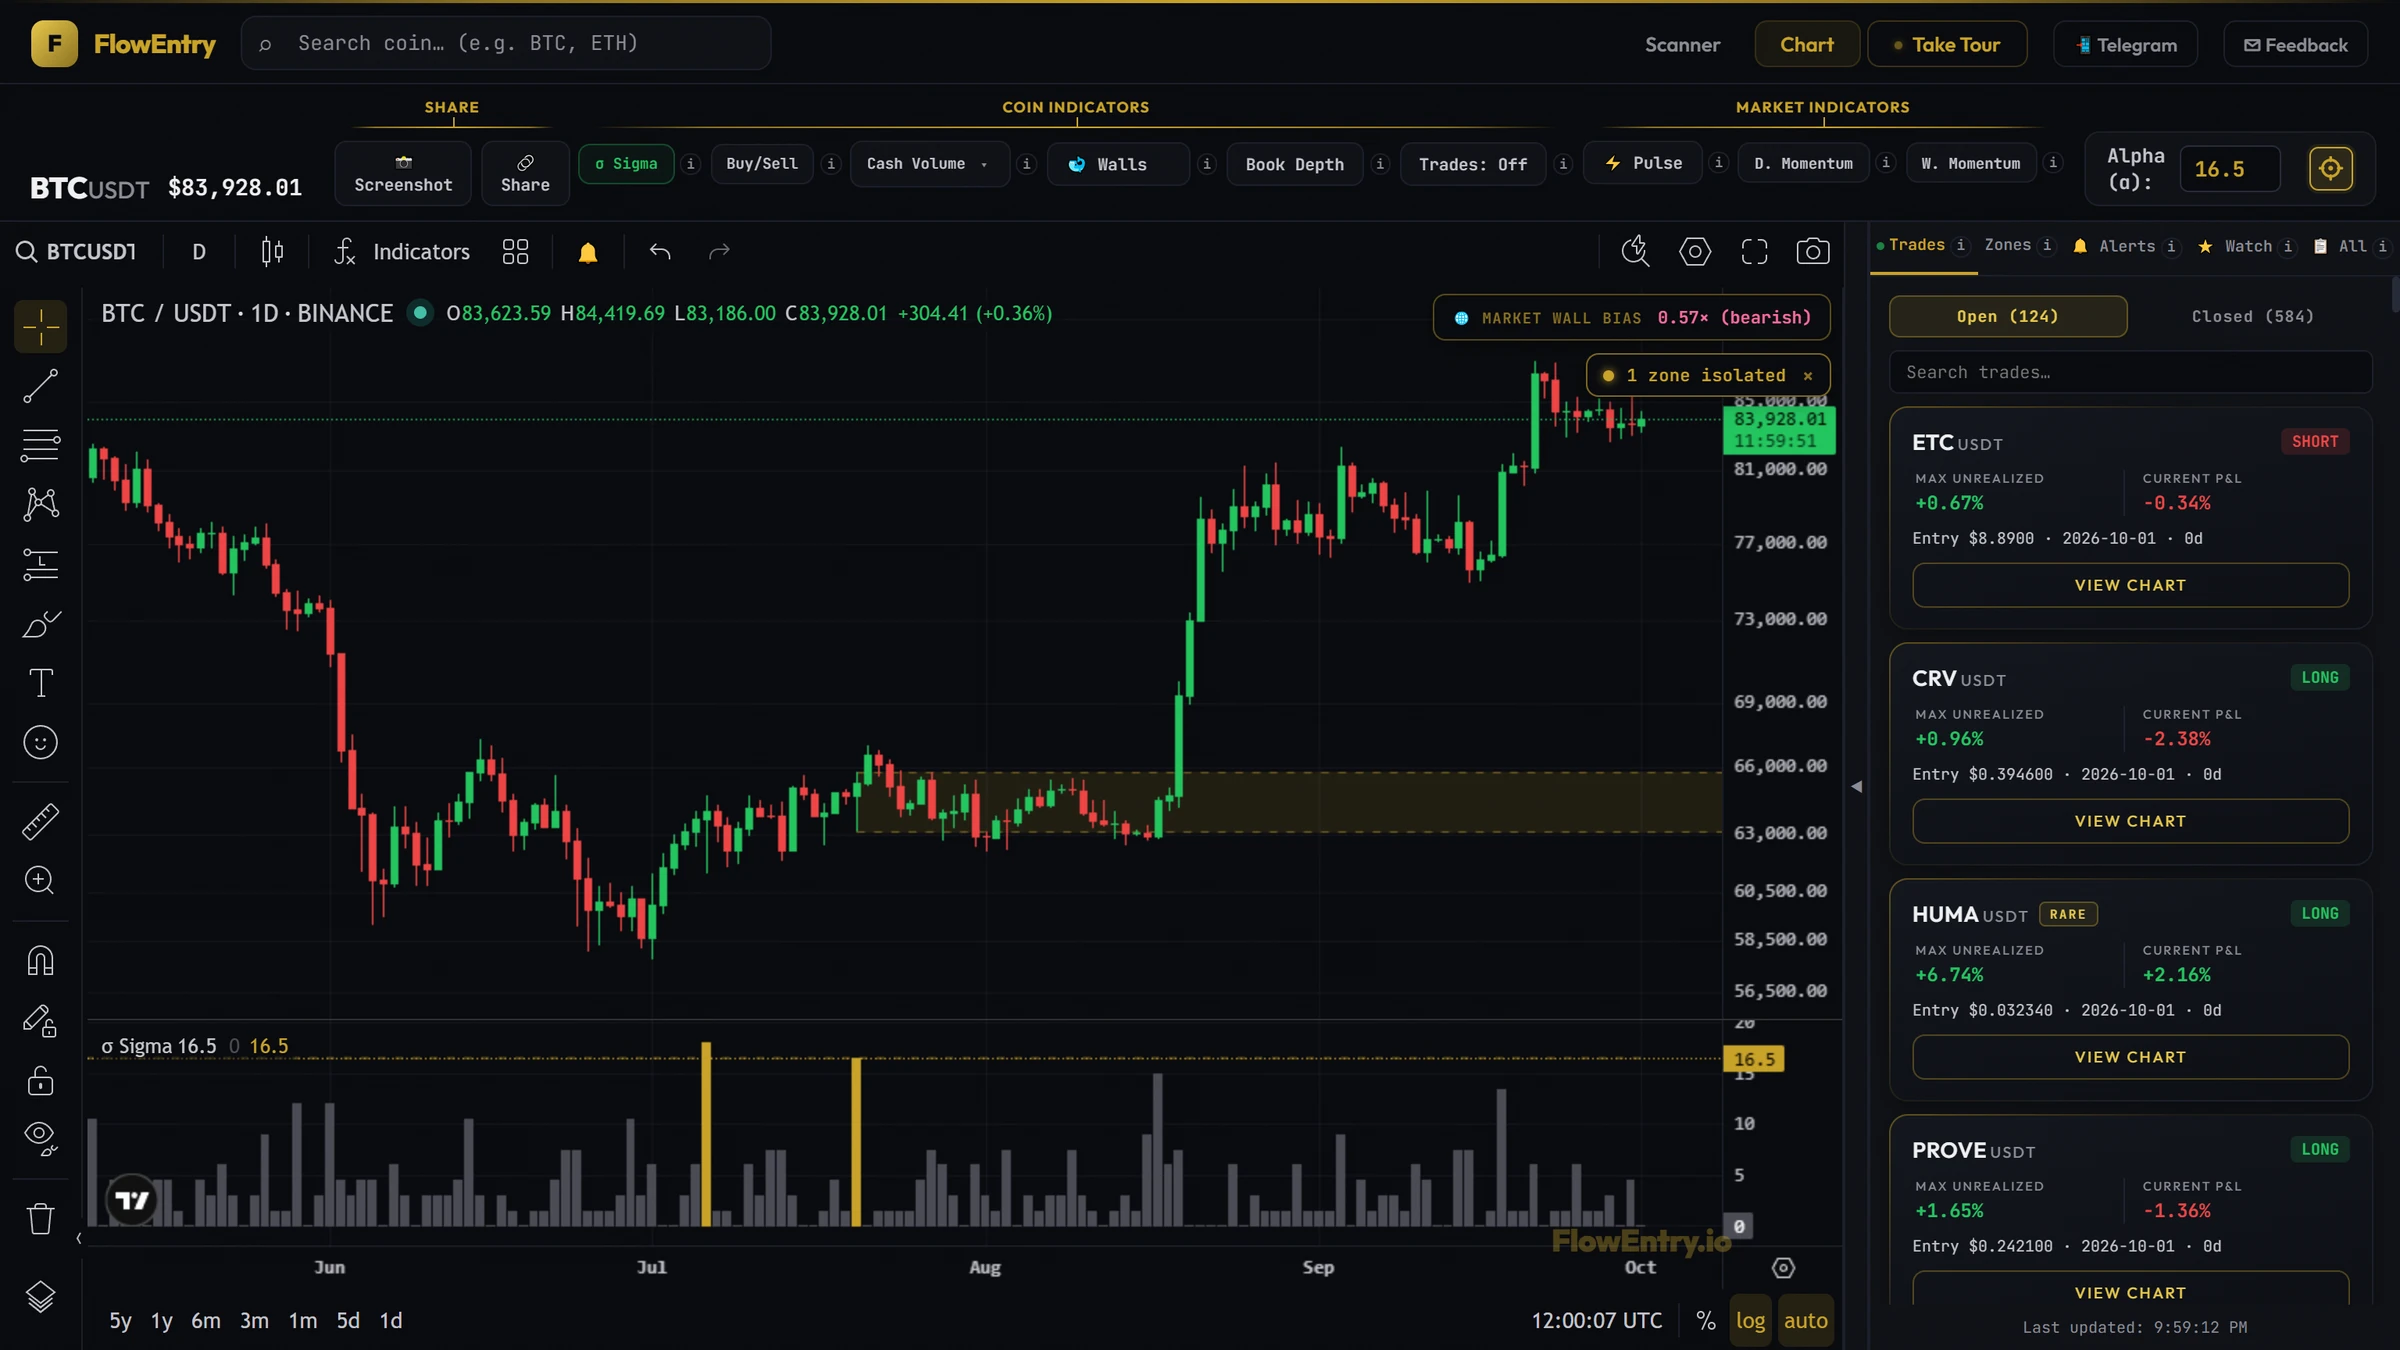
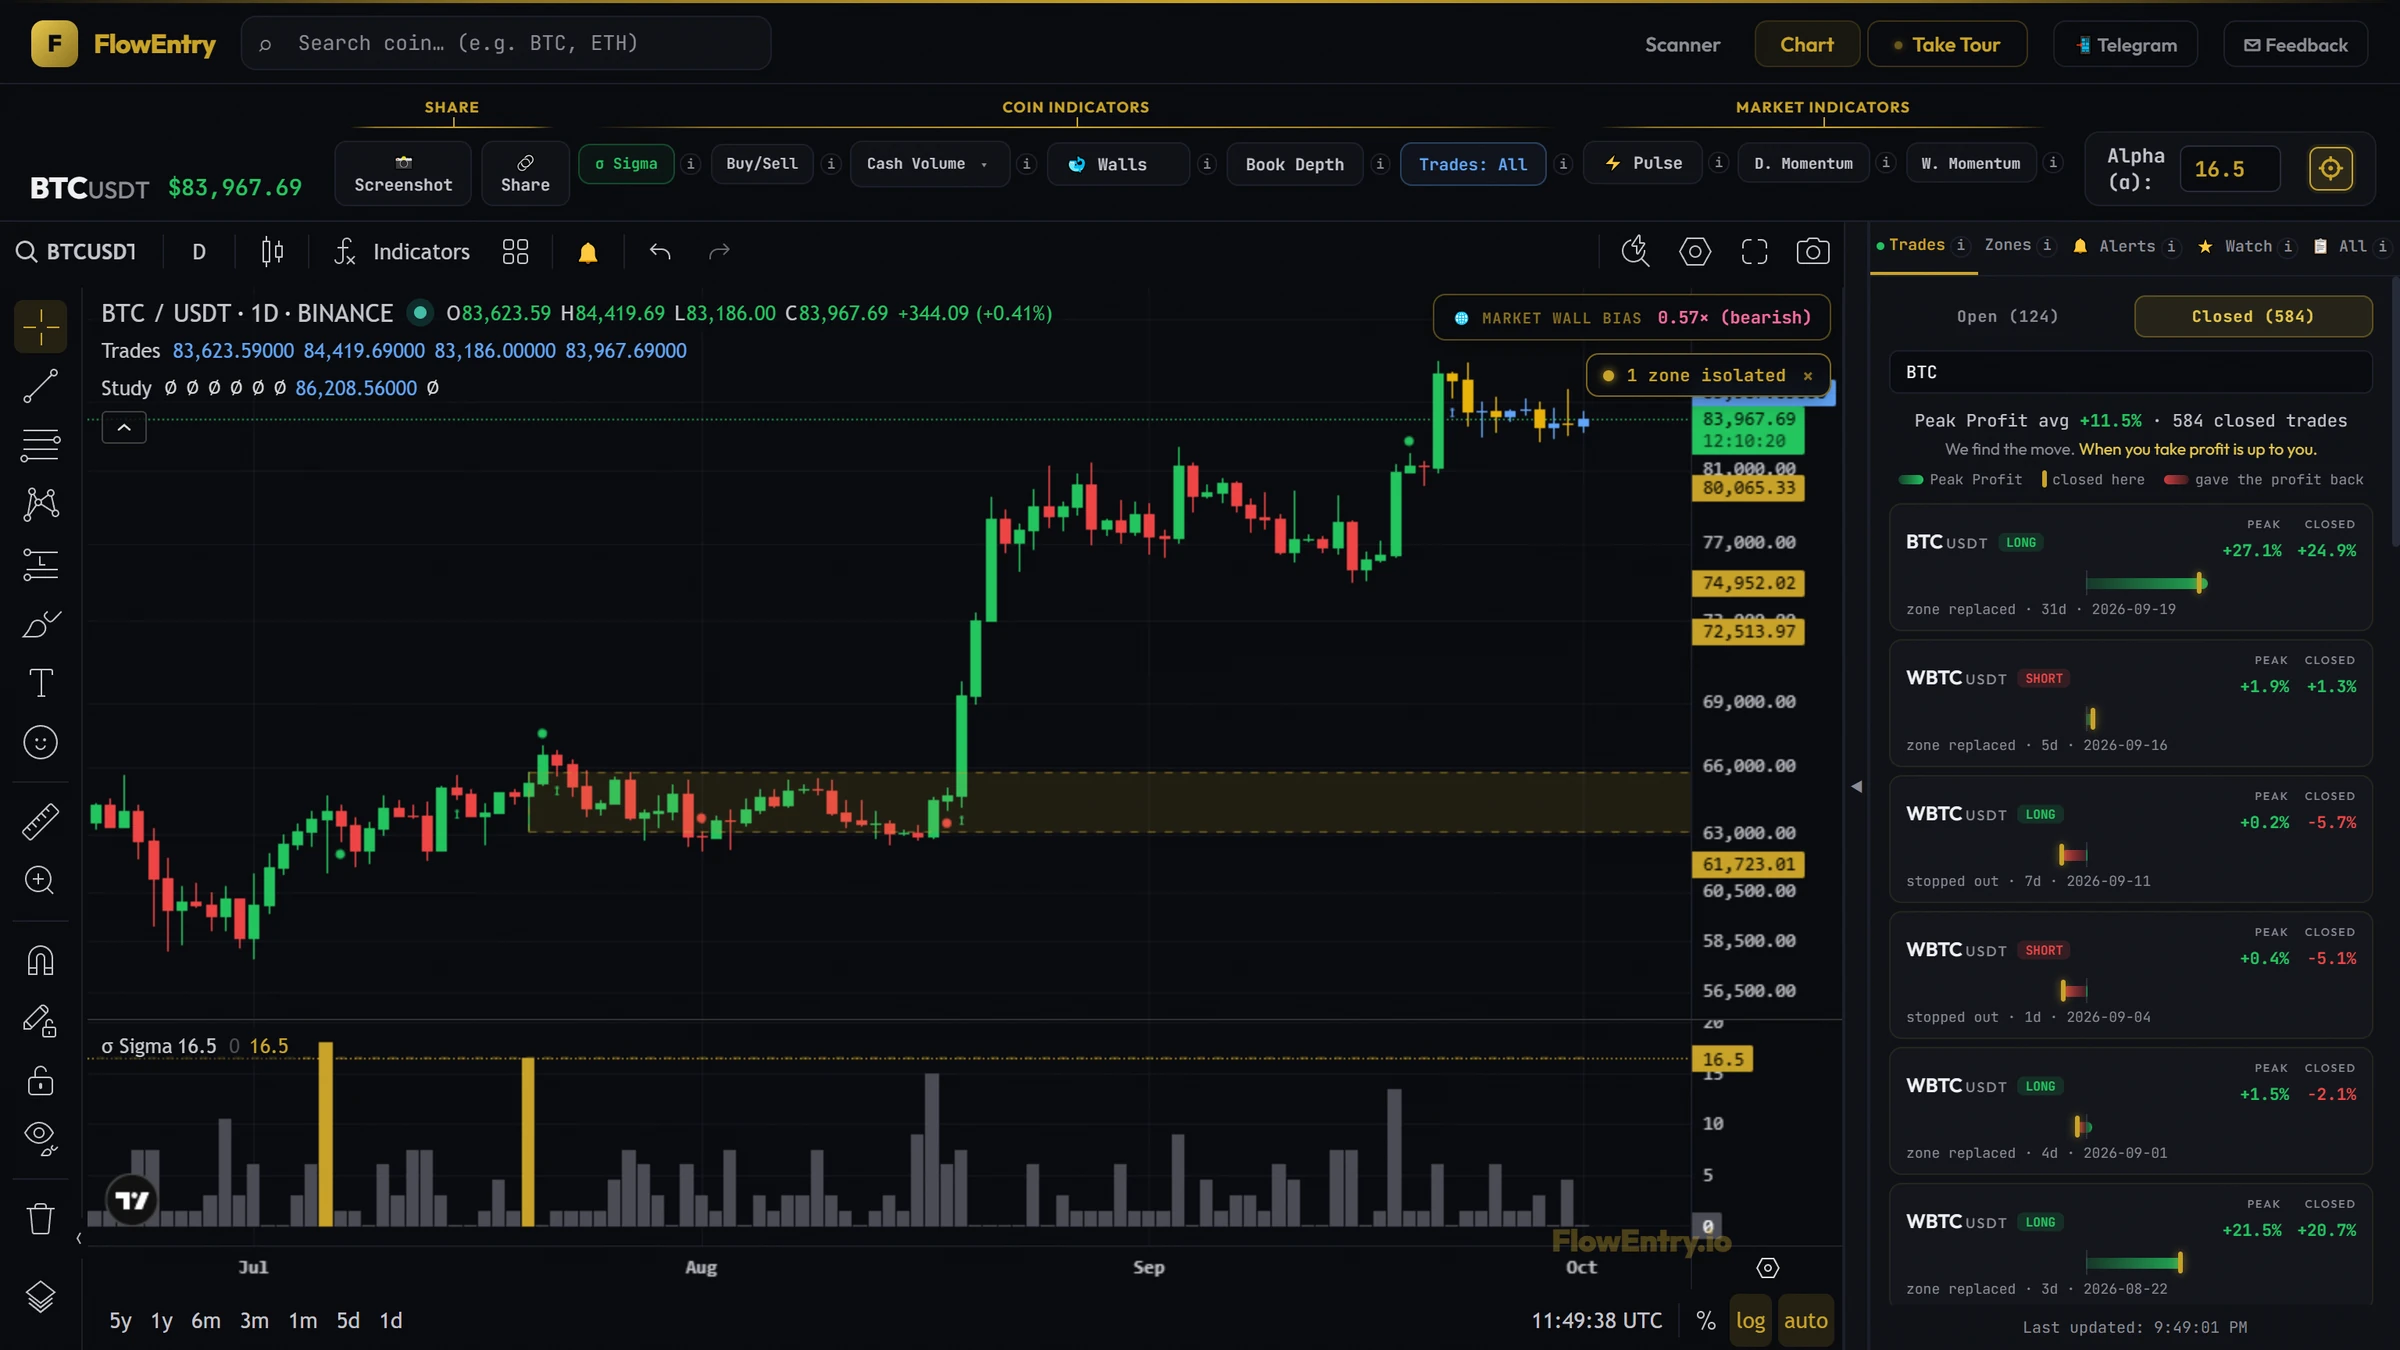
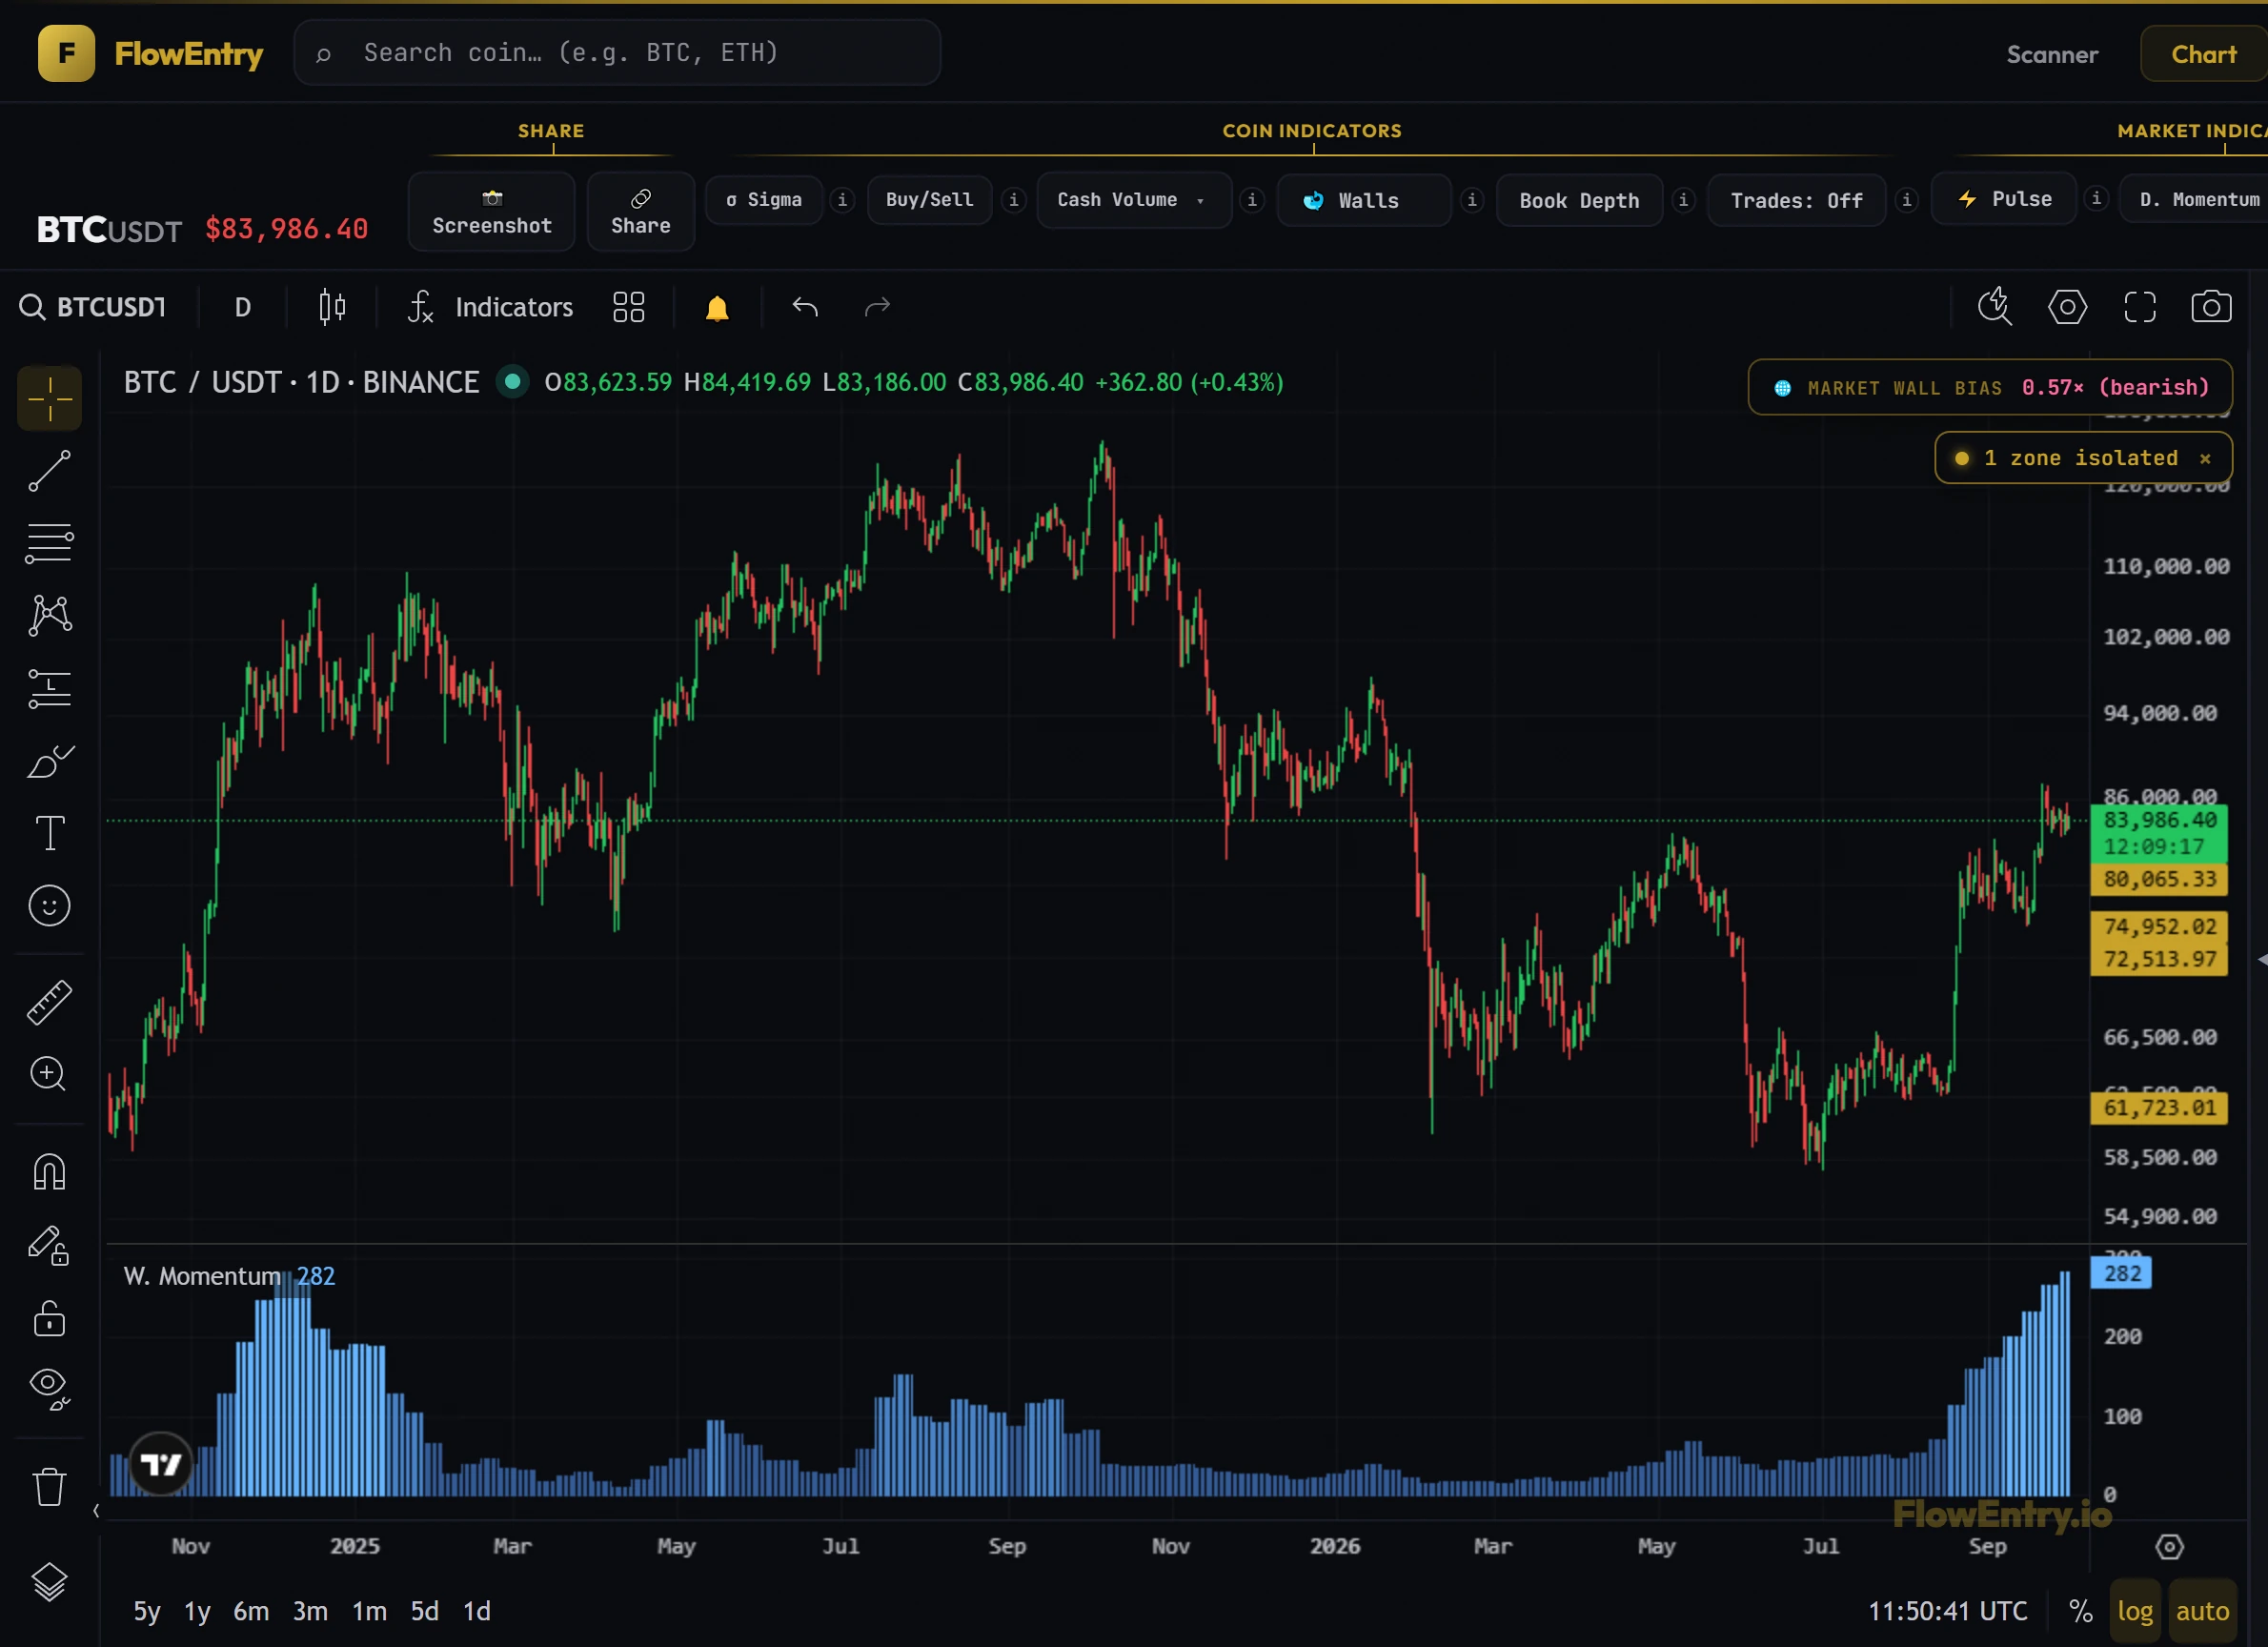
The engine scans. 600+ Binance pairs, every minute. Coins with one-sided buying or selling light up. BTC fired on 3 days that week.
Real screens from the live app, BTCUSDT
Every Signal · Losses Included · Live Since April 2026
Peak Profit, averaged
The average FlowEntry trade reaches +12.3% open profit
We find the move. When you take profit is up to you.
- closed trades
- 703
- peaked above +10%
- 39%
- reached +5% or more
- 55%
Latest closed trades
Peak / closedOpen profit reached before exit, averaged across all 703 completed trades. Historical data, not a promise. The list shows the most recent closes, good or bad, straight from the log.
The daily routine
Five questions. One chart.
This is how members use FlowEntry each morning. Every screen below is the real app on a real coin.
01 · Scanner
What moved?
Start on the scanner. It lists every coin with one-sided flow today. Flip to Yesterday, 7D or 30D to see which coins kept firing. Gold tiles crossed their threshold, and the flame shows on how many days.
Right now68 coins on today's scanner. Free visitors can open STRK.
02 · Sigma
Is it rare?
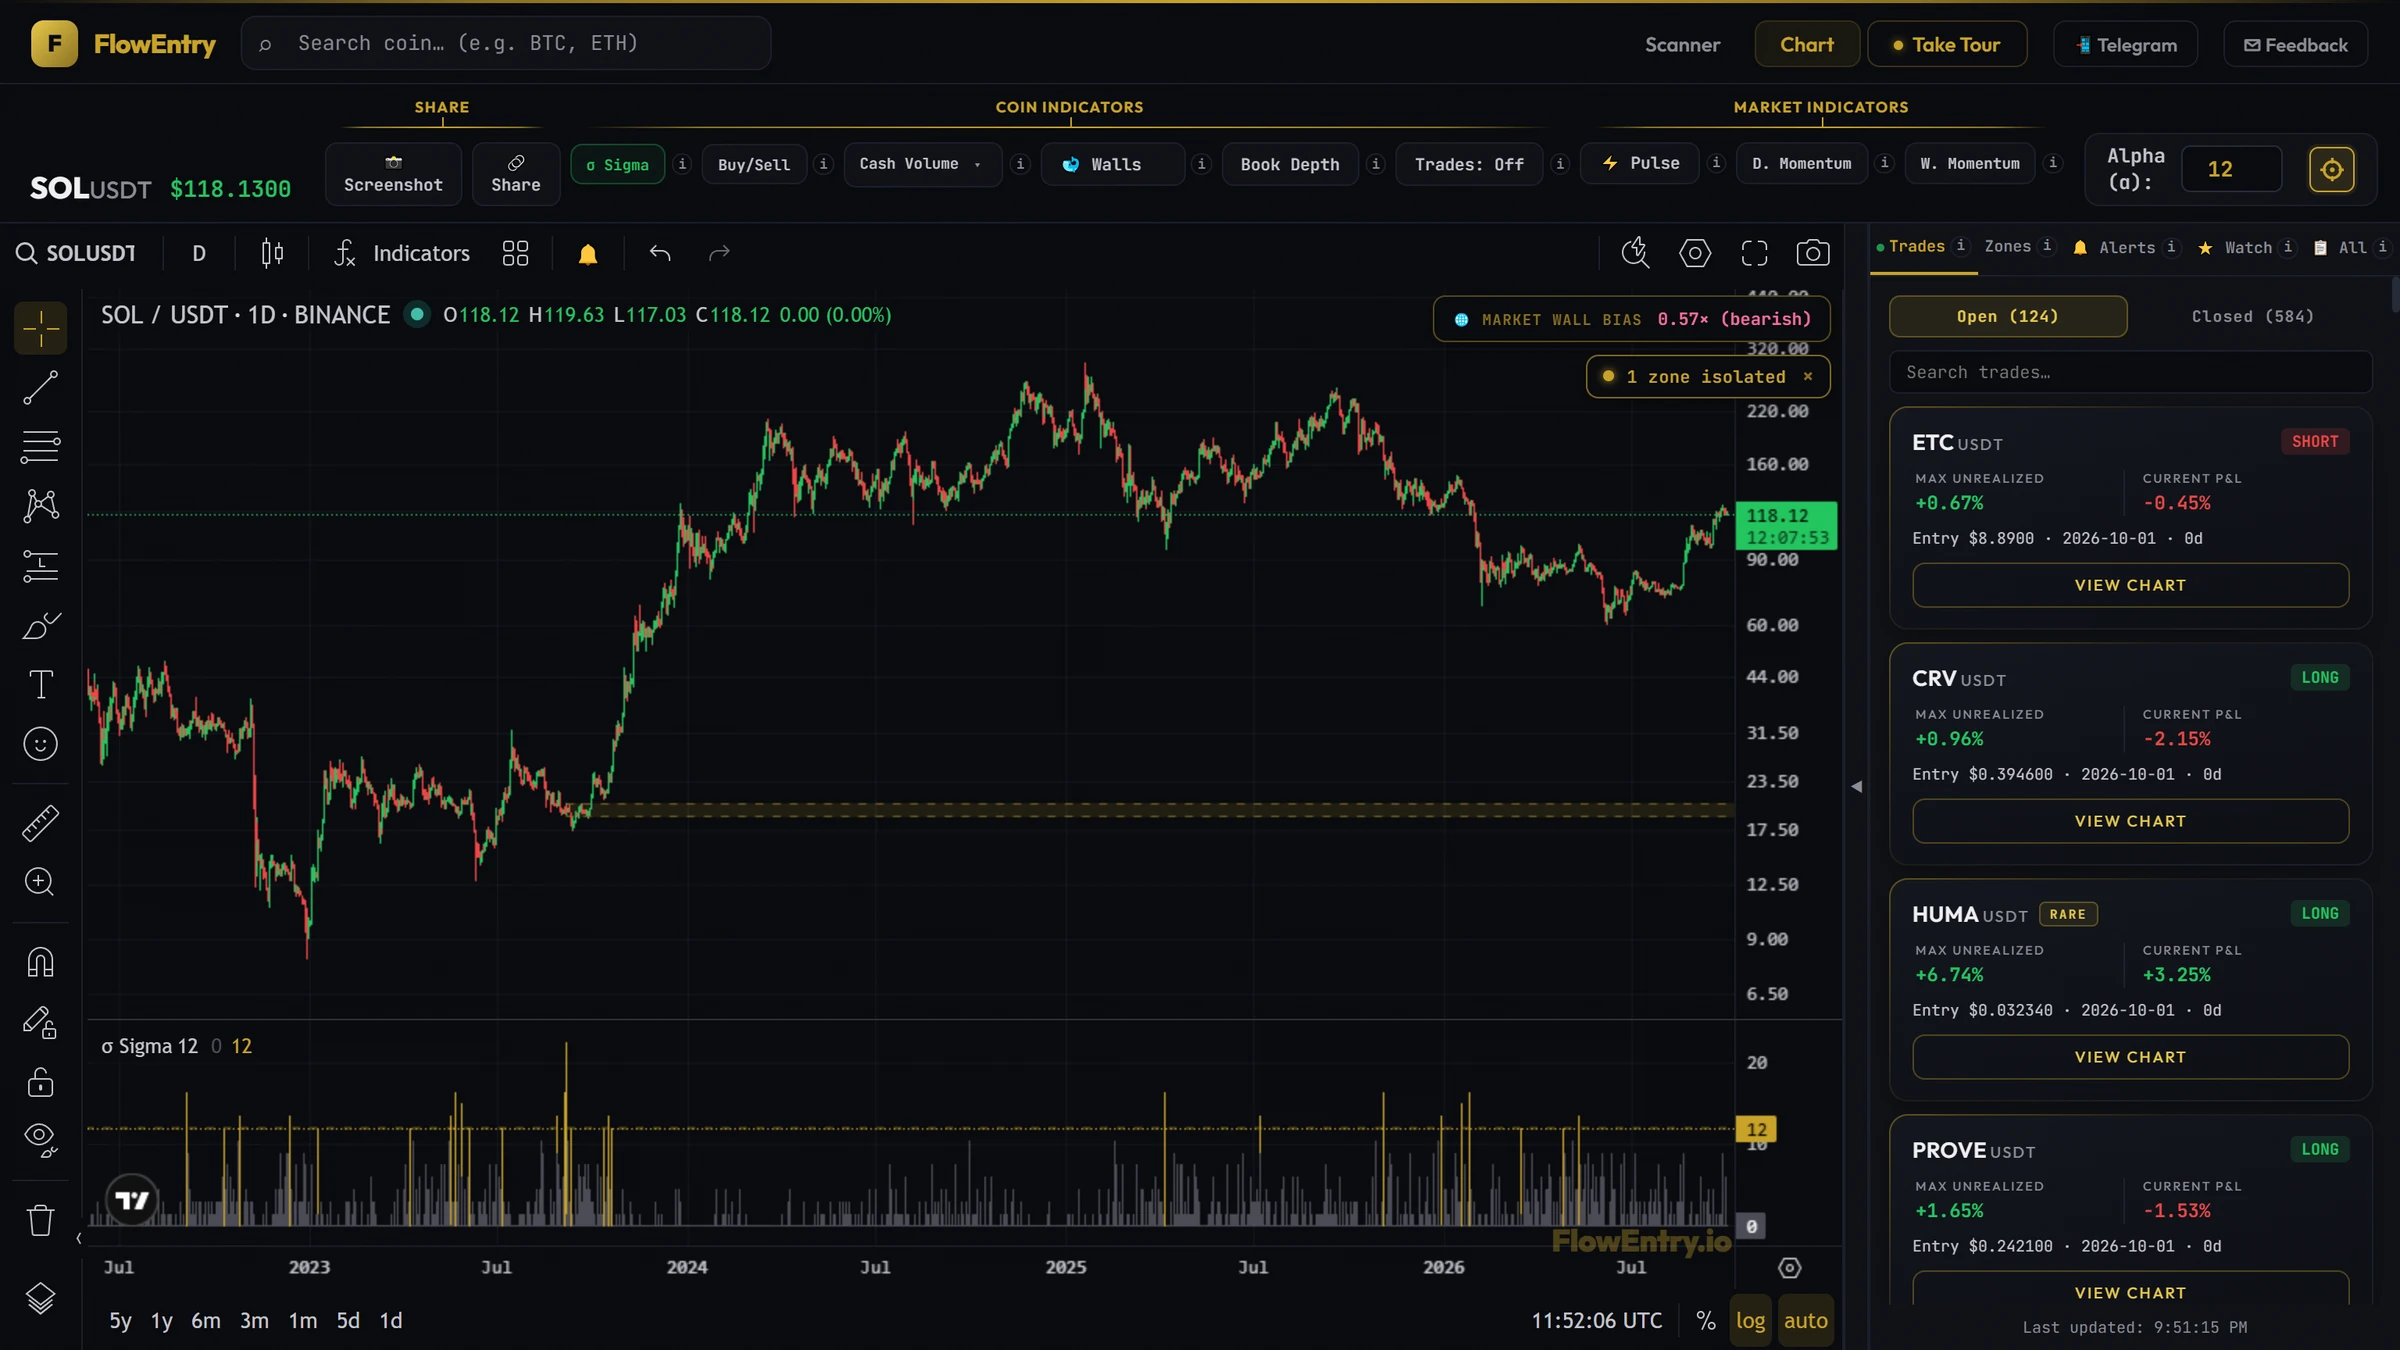
Open the chart and zoom all the way out. SOL’s biggest Sigma day ever came on 5 September 2023, with price near $20. SOL went past $200 after. Today, record flow like that earns a gold RARE tag in the sidebar.
03 · Cash Volume
How much money, and which side?
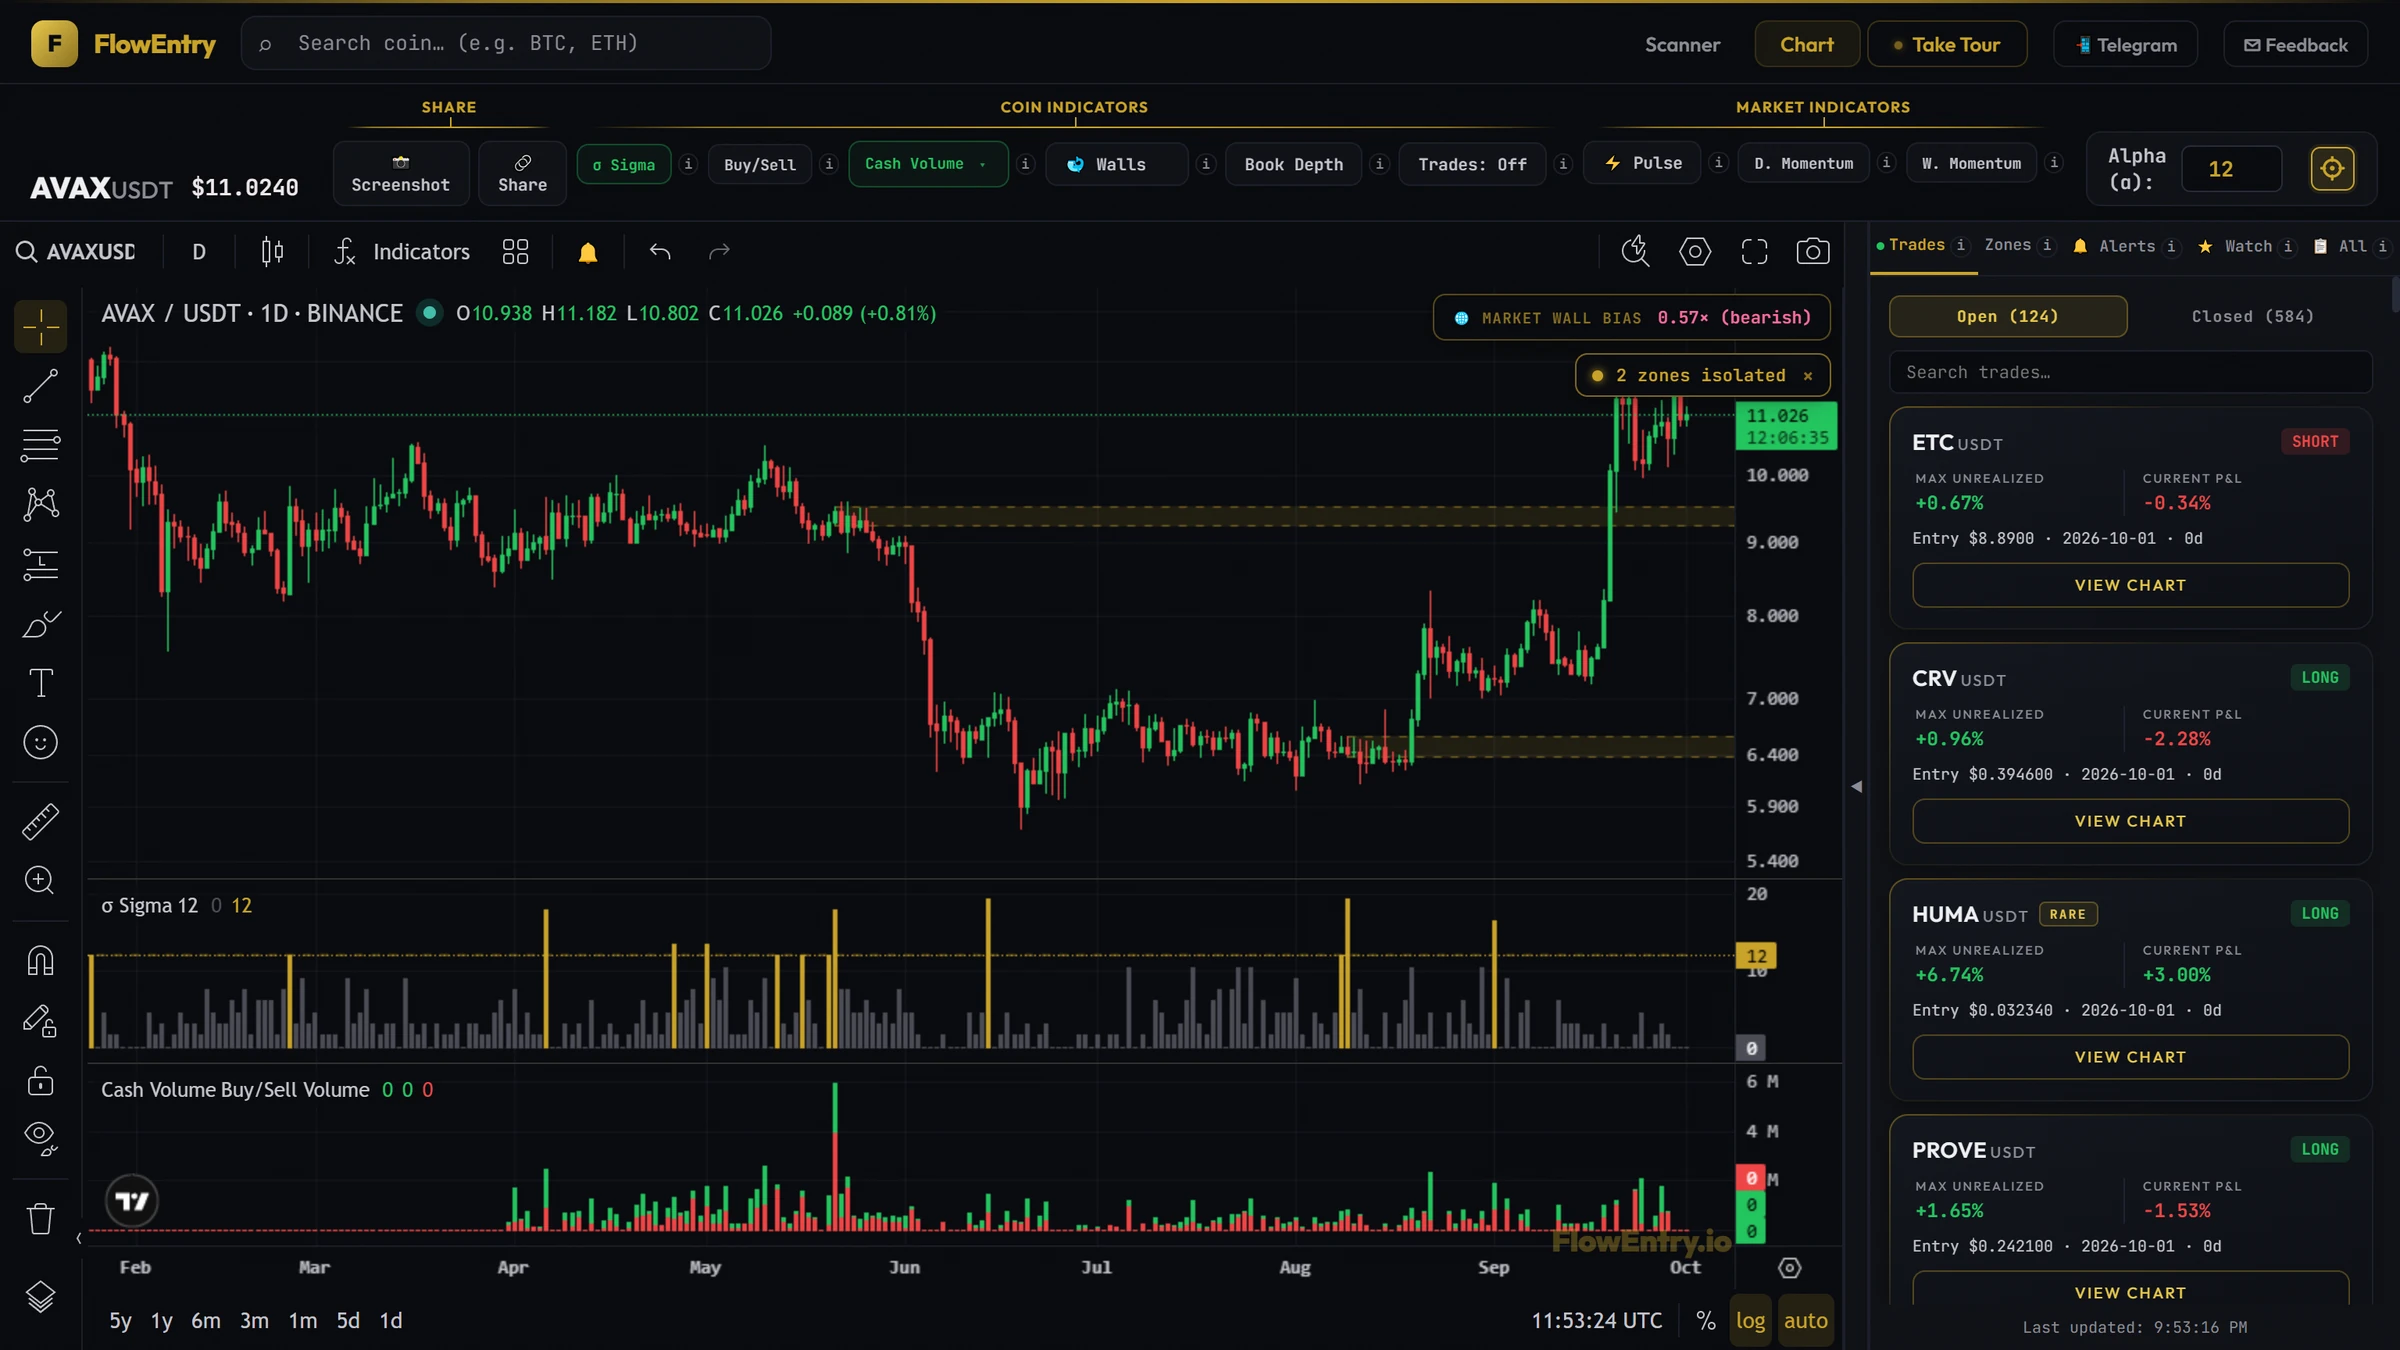
Cash Volume puts a dollar size on the flow. Switch it to Buy/Sell to see who did it. On 21 May, $3.9M of the $6.0M traded on AVAX was selling. Price slid from about $9.40 to near $6 in the weeks after.
04 · Whale Walls + Book Depth
Where are the big orders?
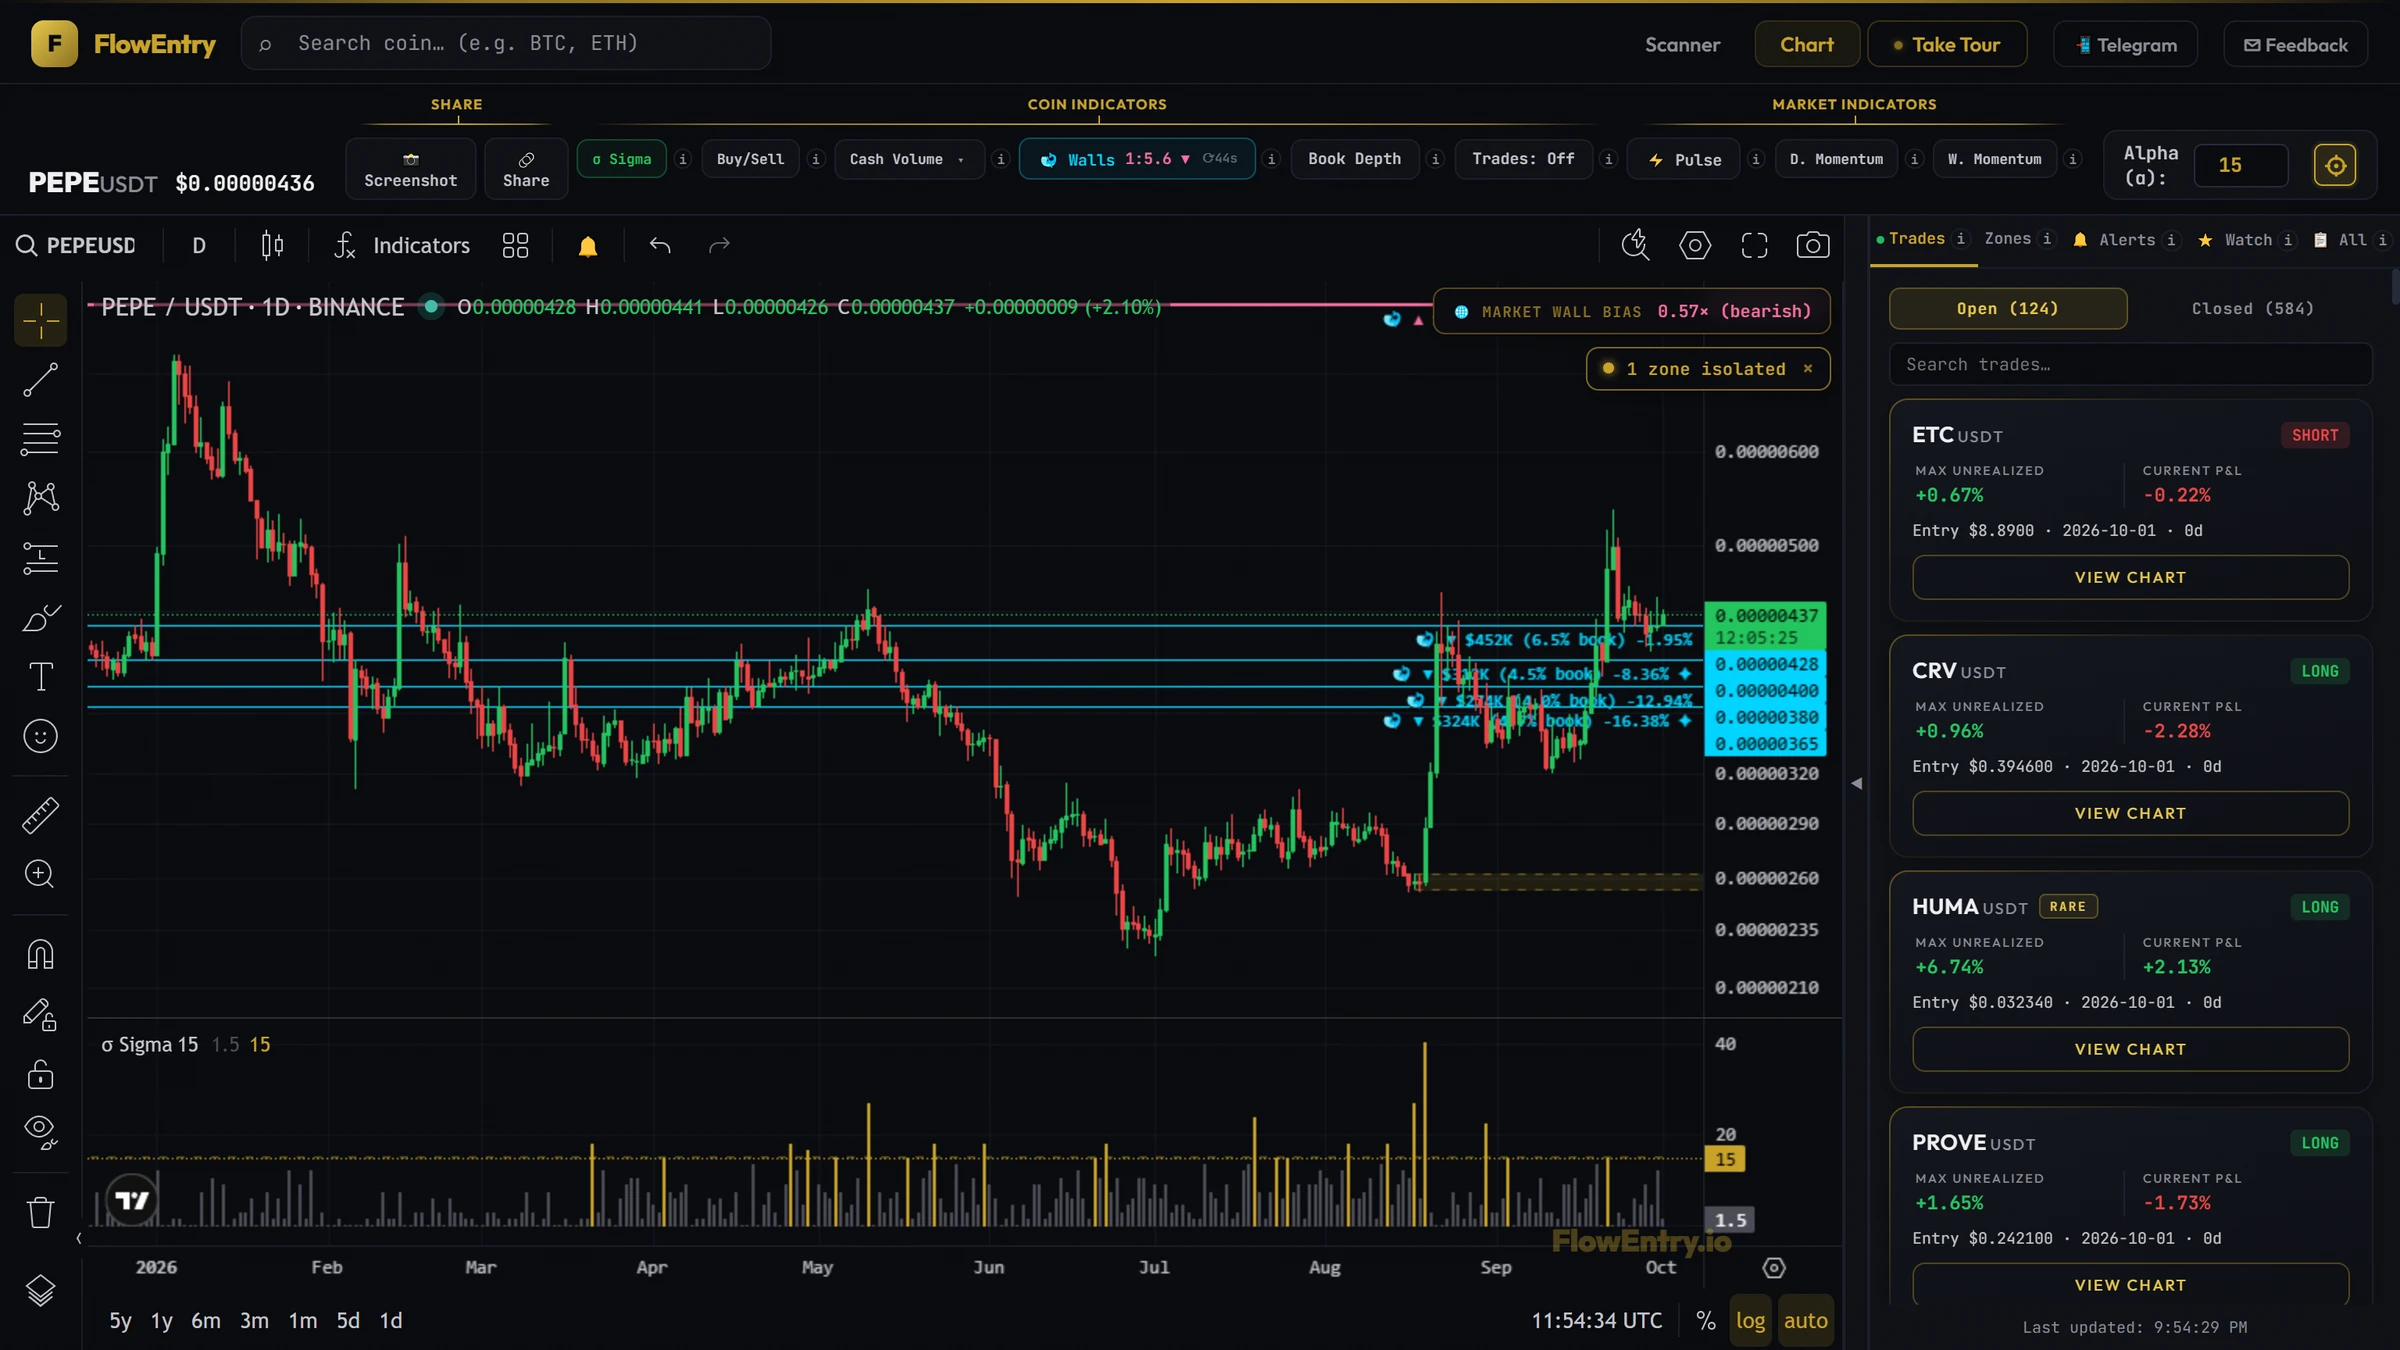
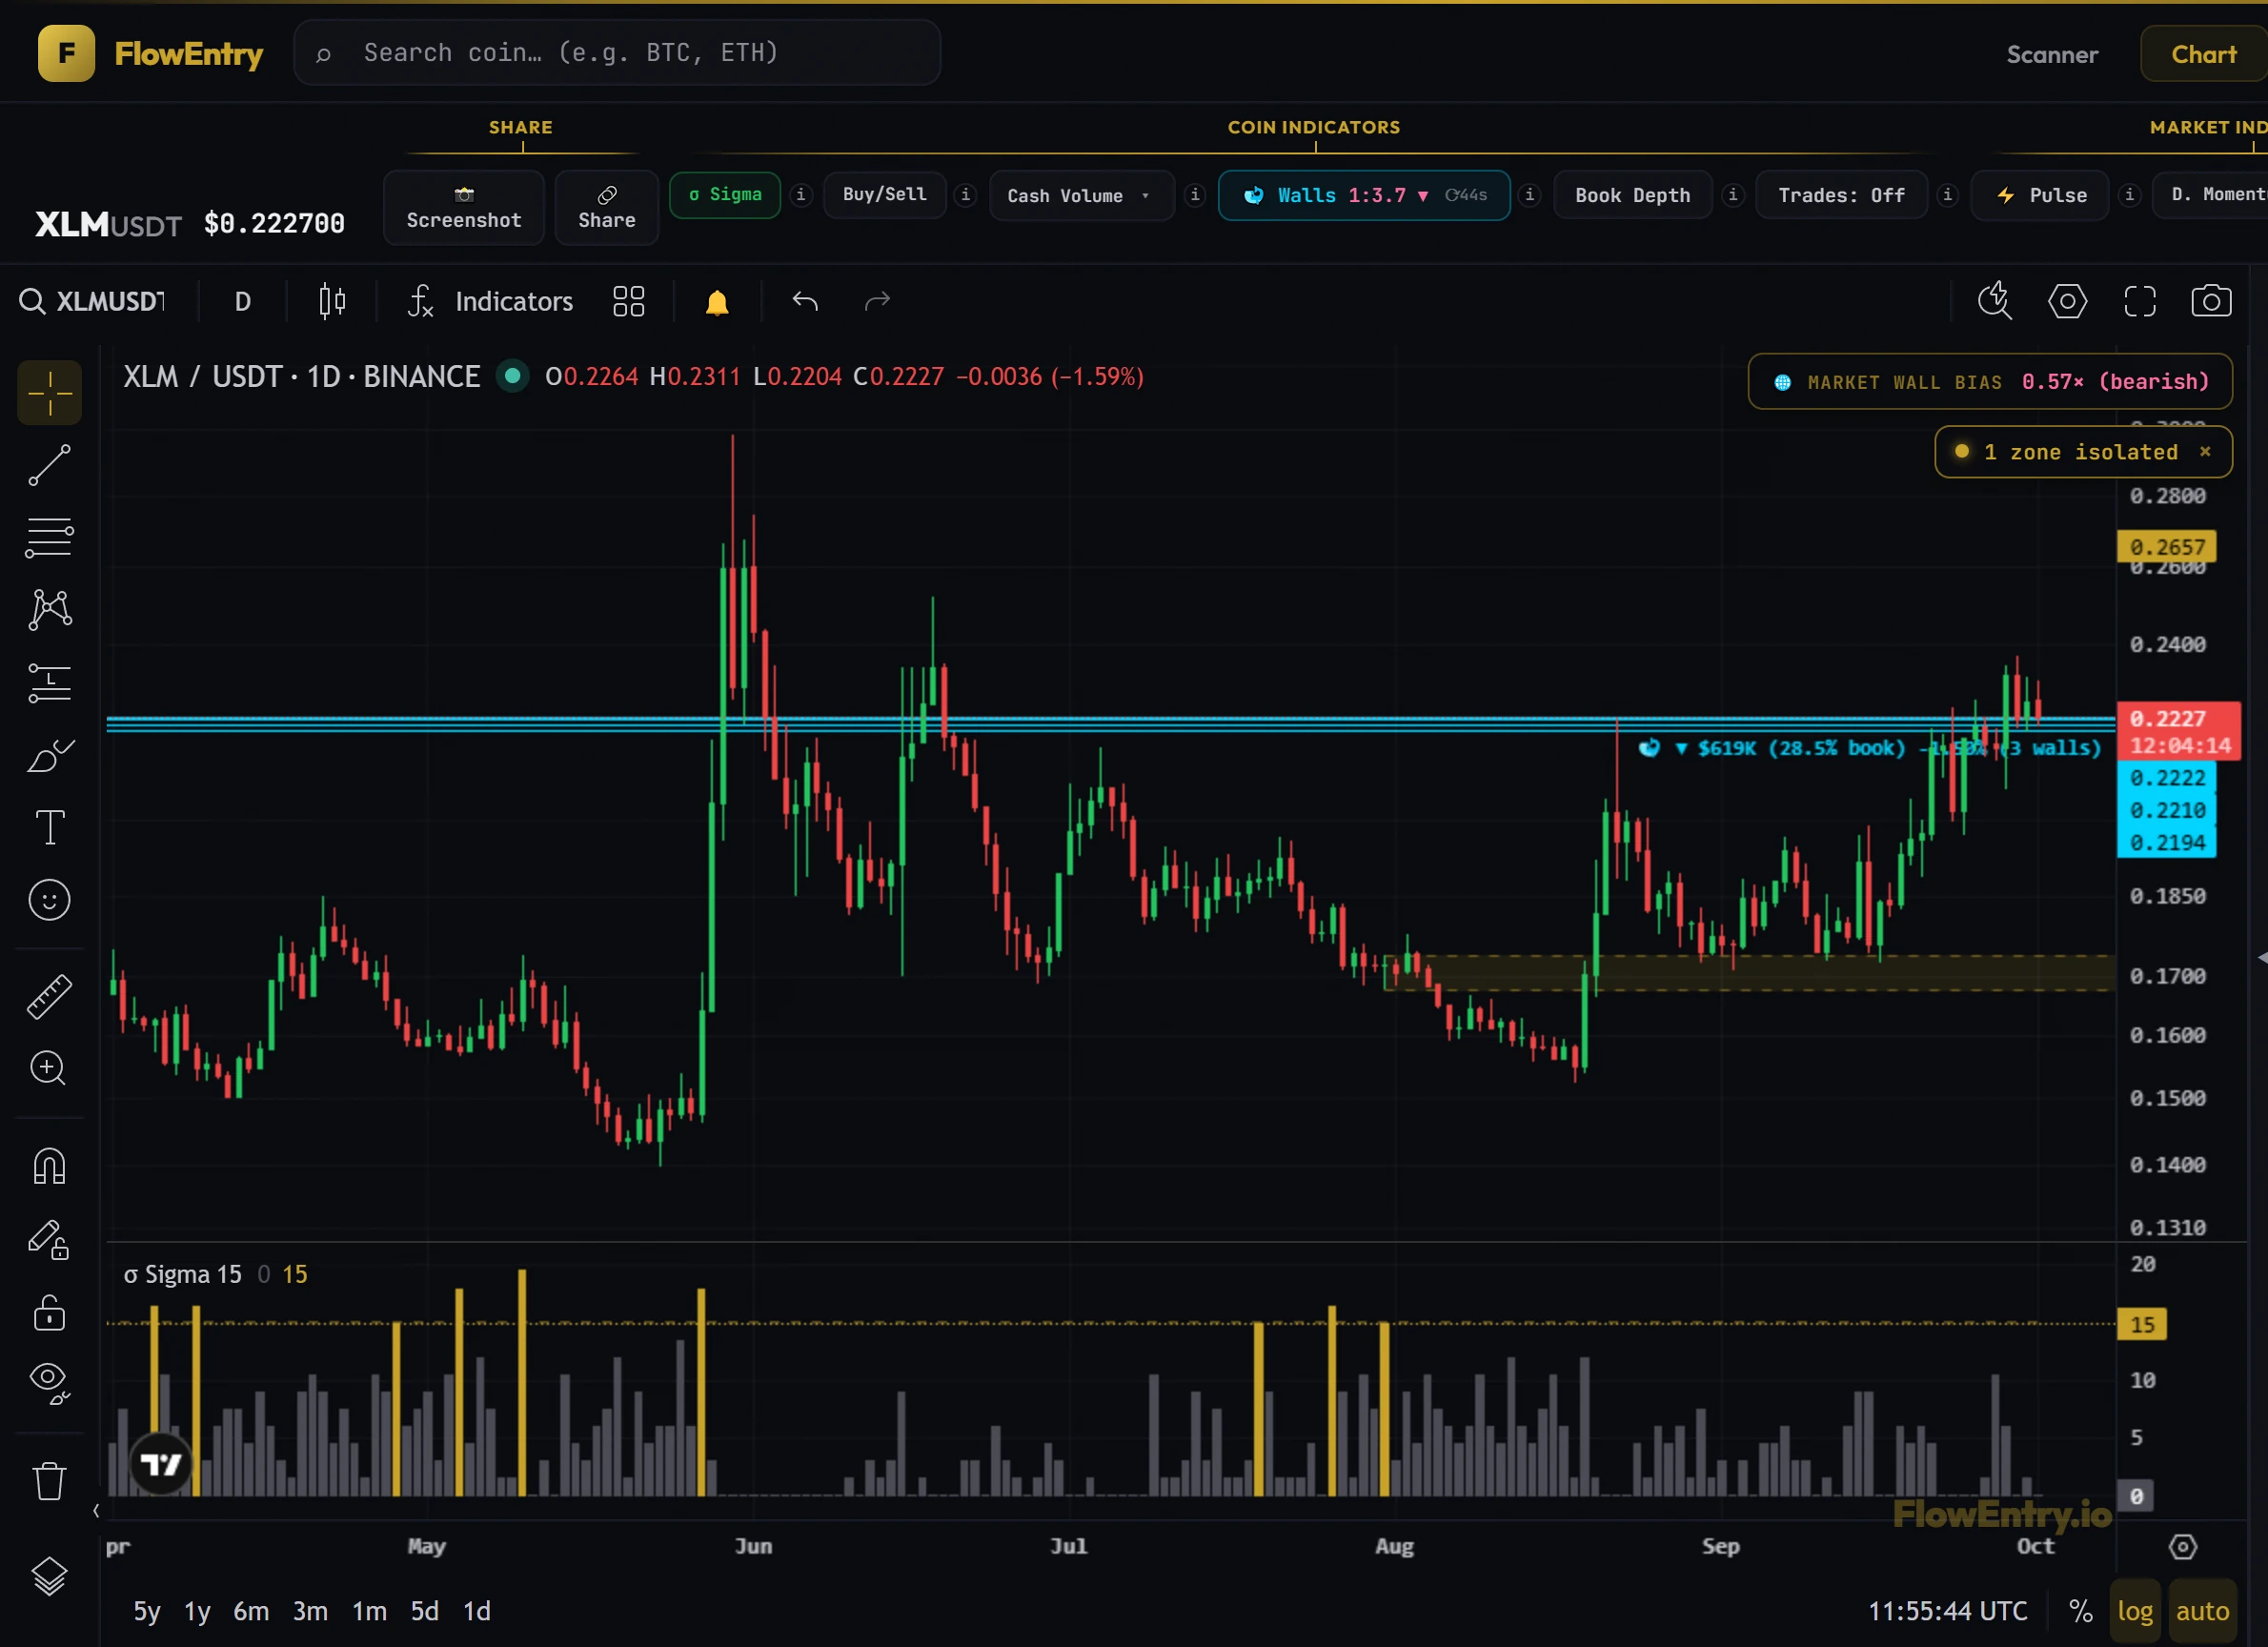
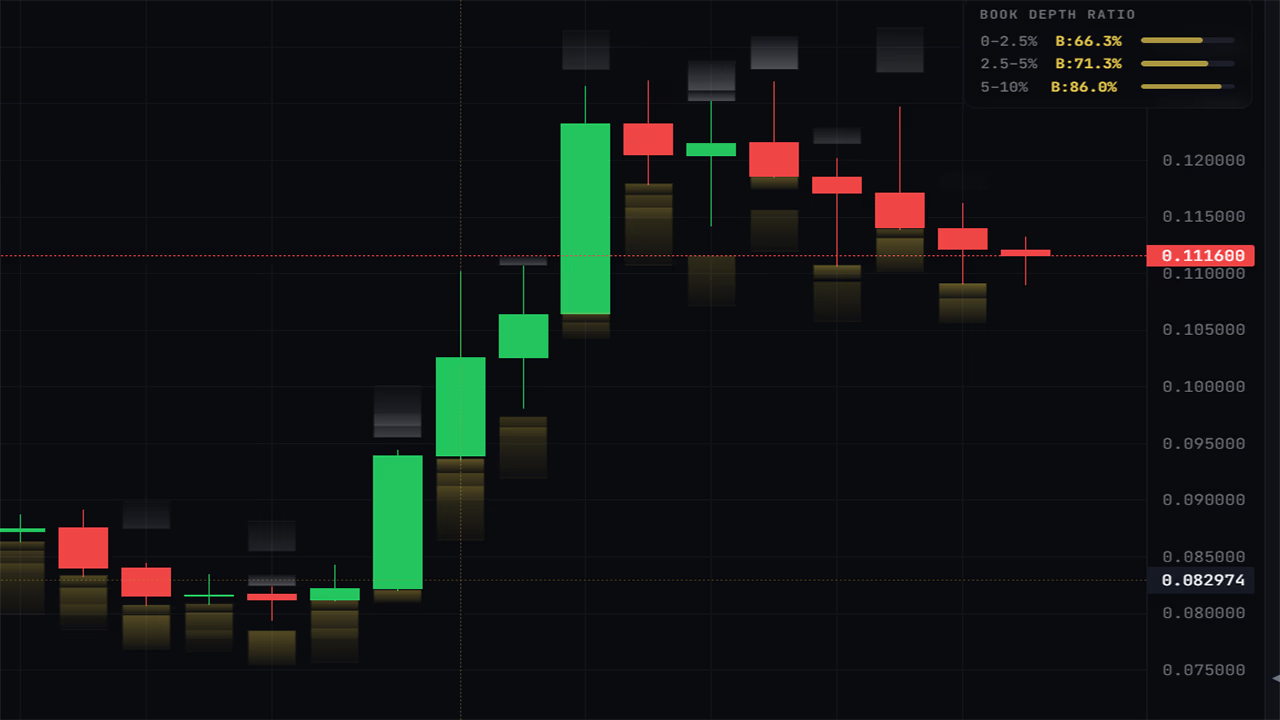
Whale Walls draw the largest resting orders above and below price, with their dollar size. Book Depth shows which side has more liquidity near price.
05 · Price alerts
Tell me when it matters.
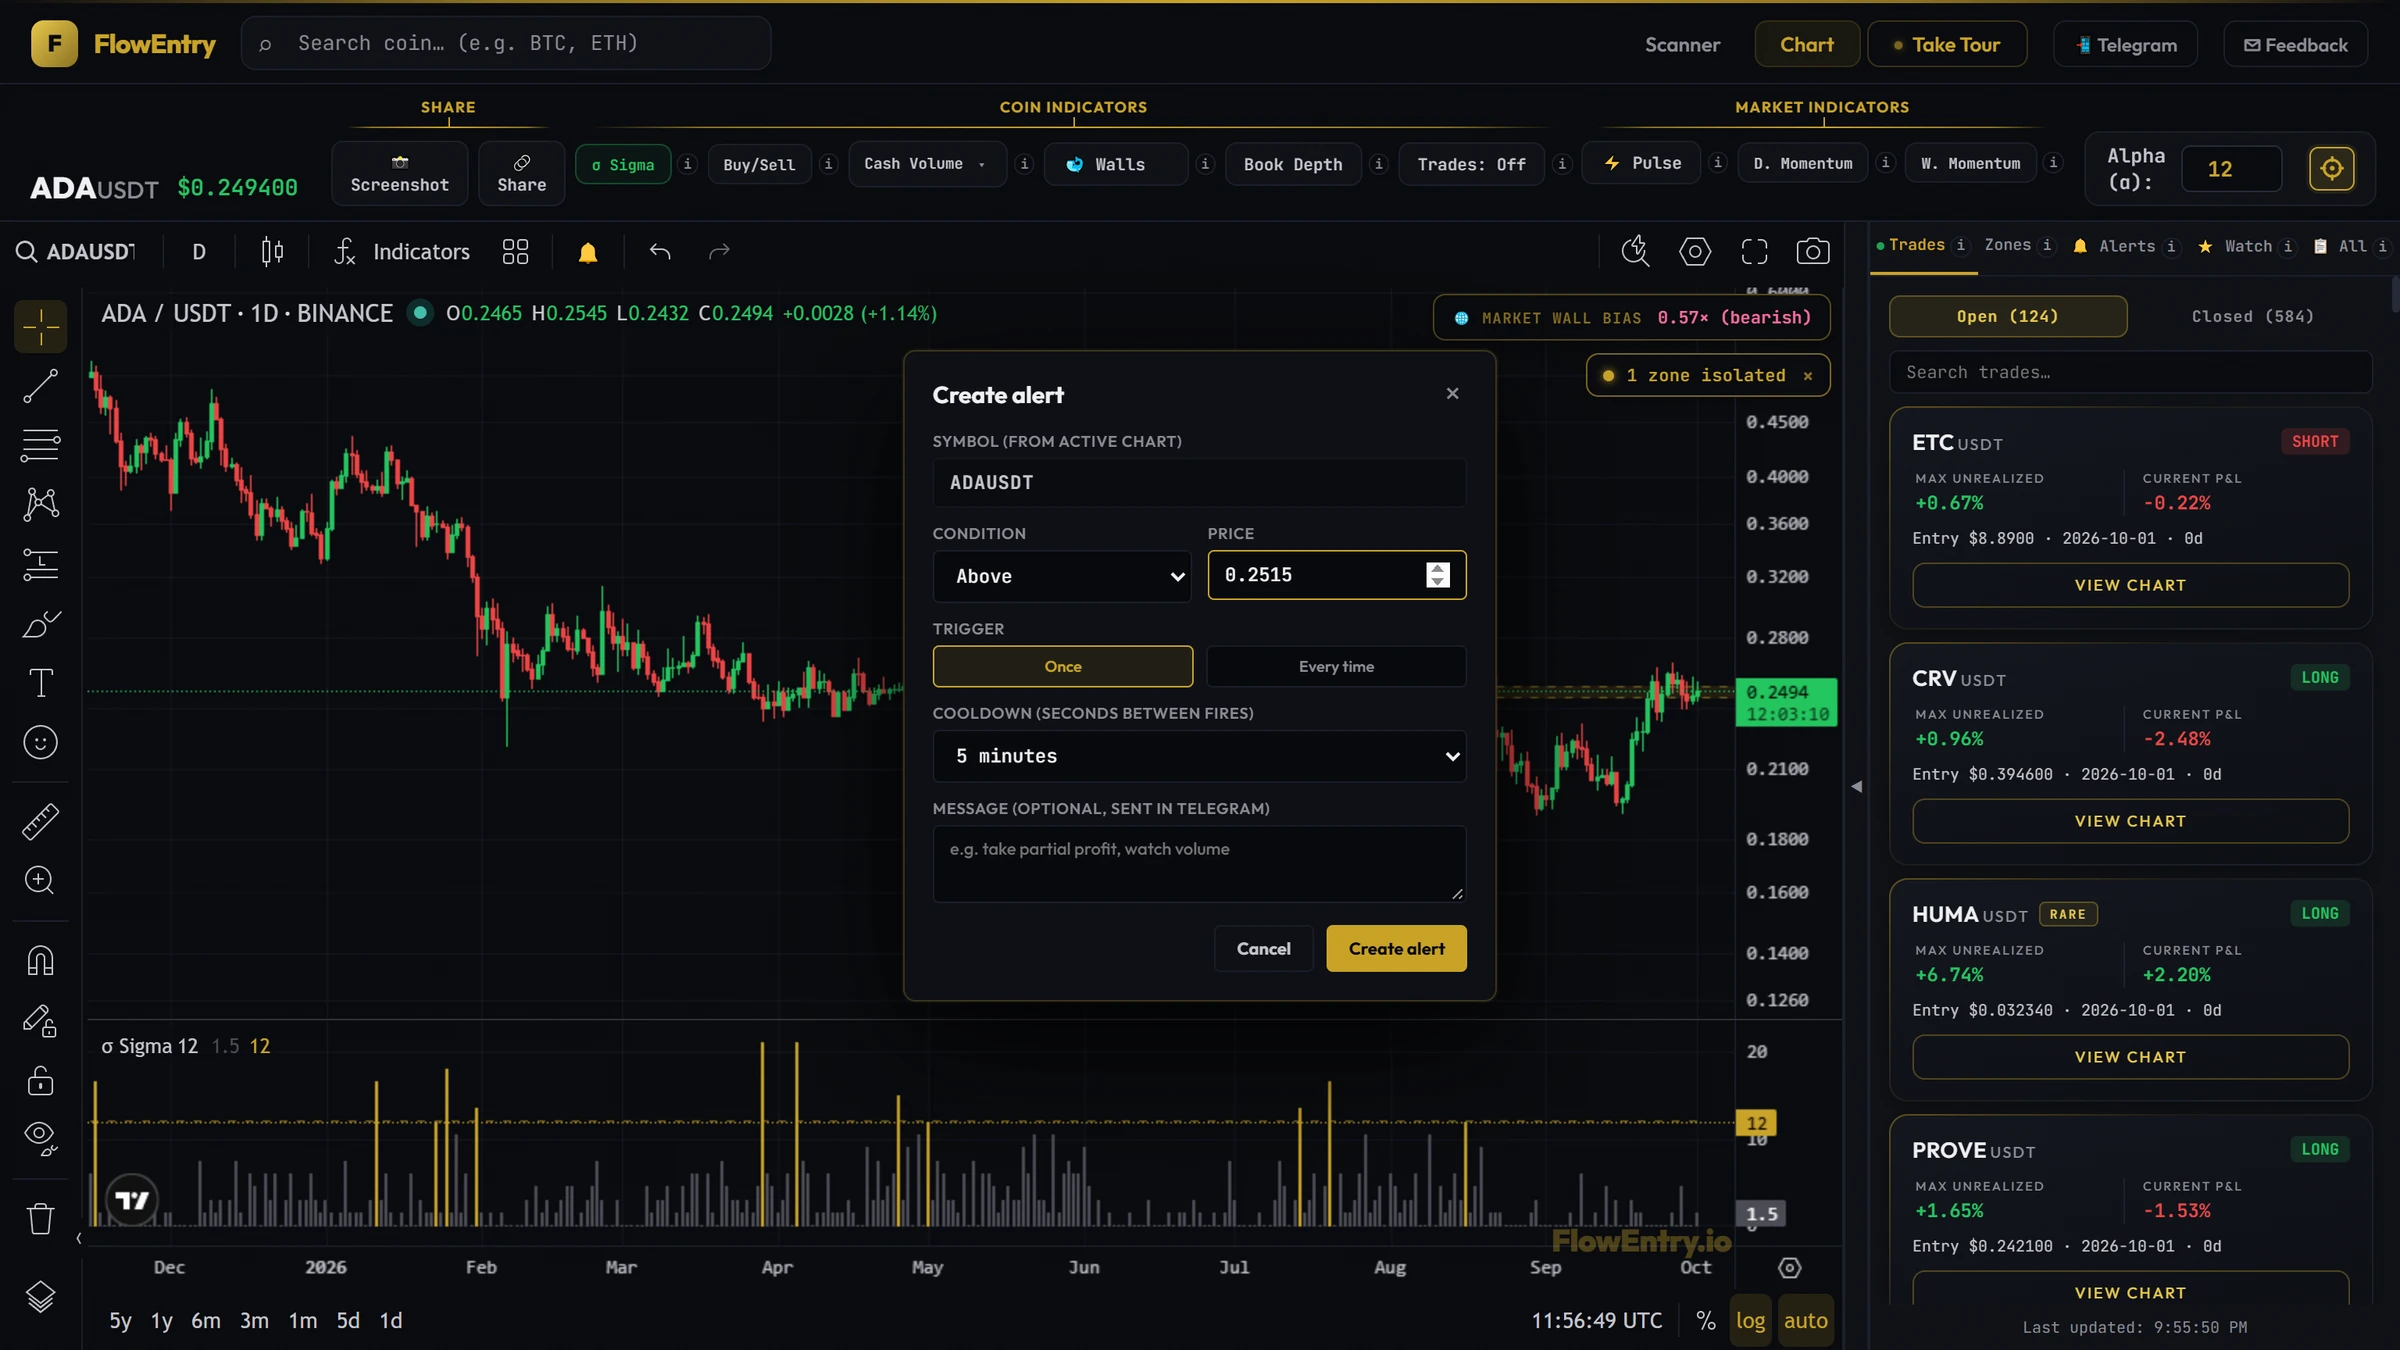
Set up to 100 price alerts. Put one on the zone edge and close the laptop. Telegram pings you when price gets there. And every day at the close, the private channel sends members the coins that fired, new zones and trade updates.
Built in
Eight tools. Each answers one question.
All of them live on the same chart. Pick one to see it on a real coin.
Coin
Market
Order book
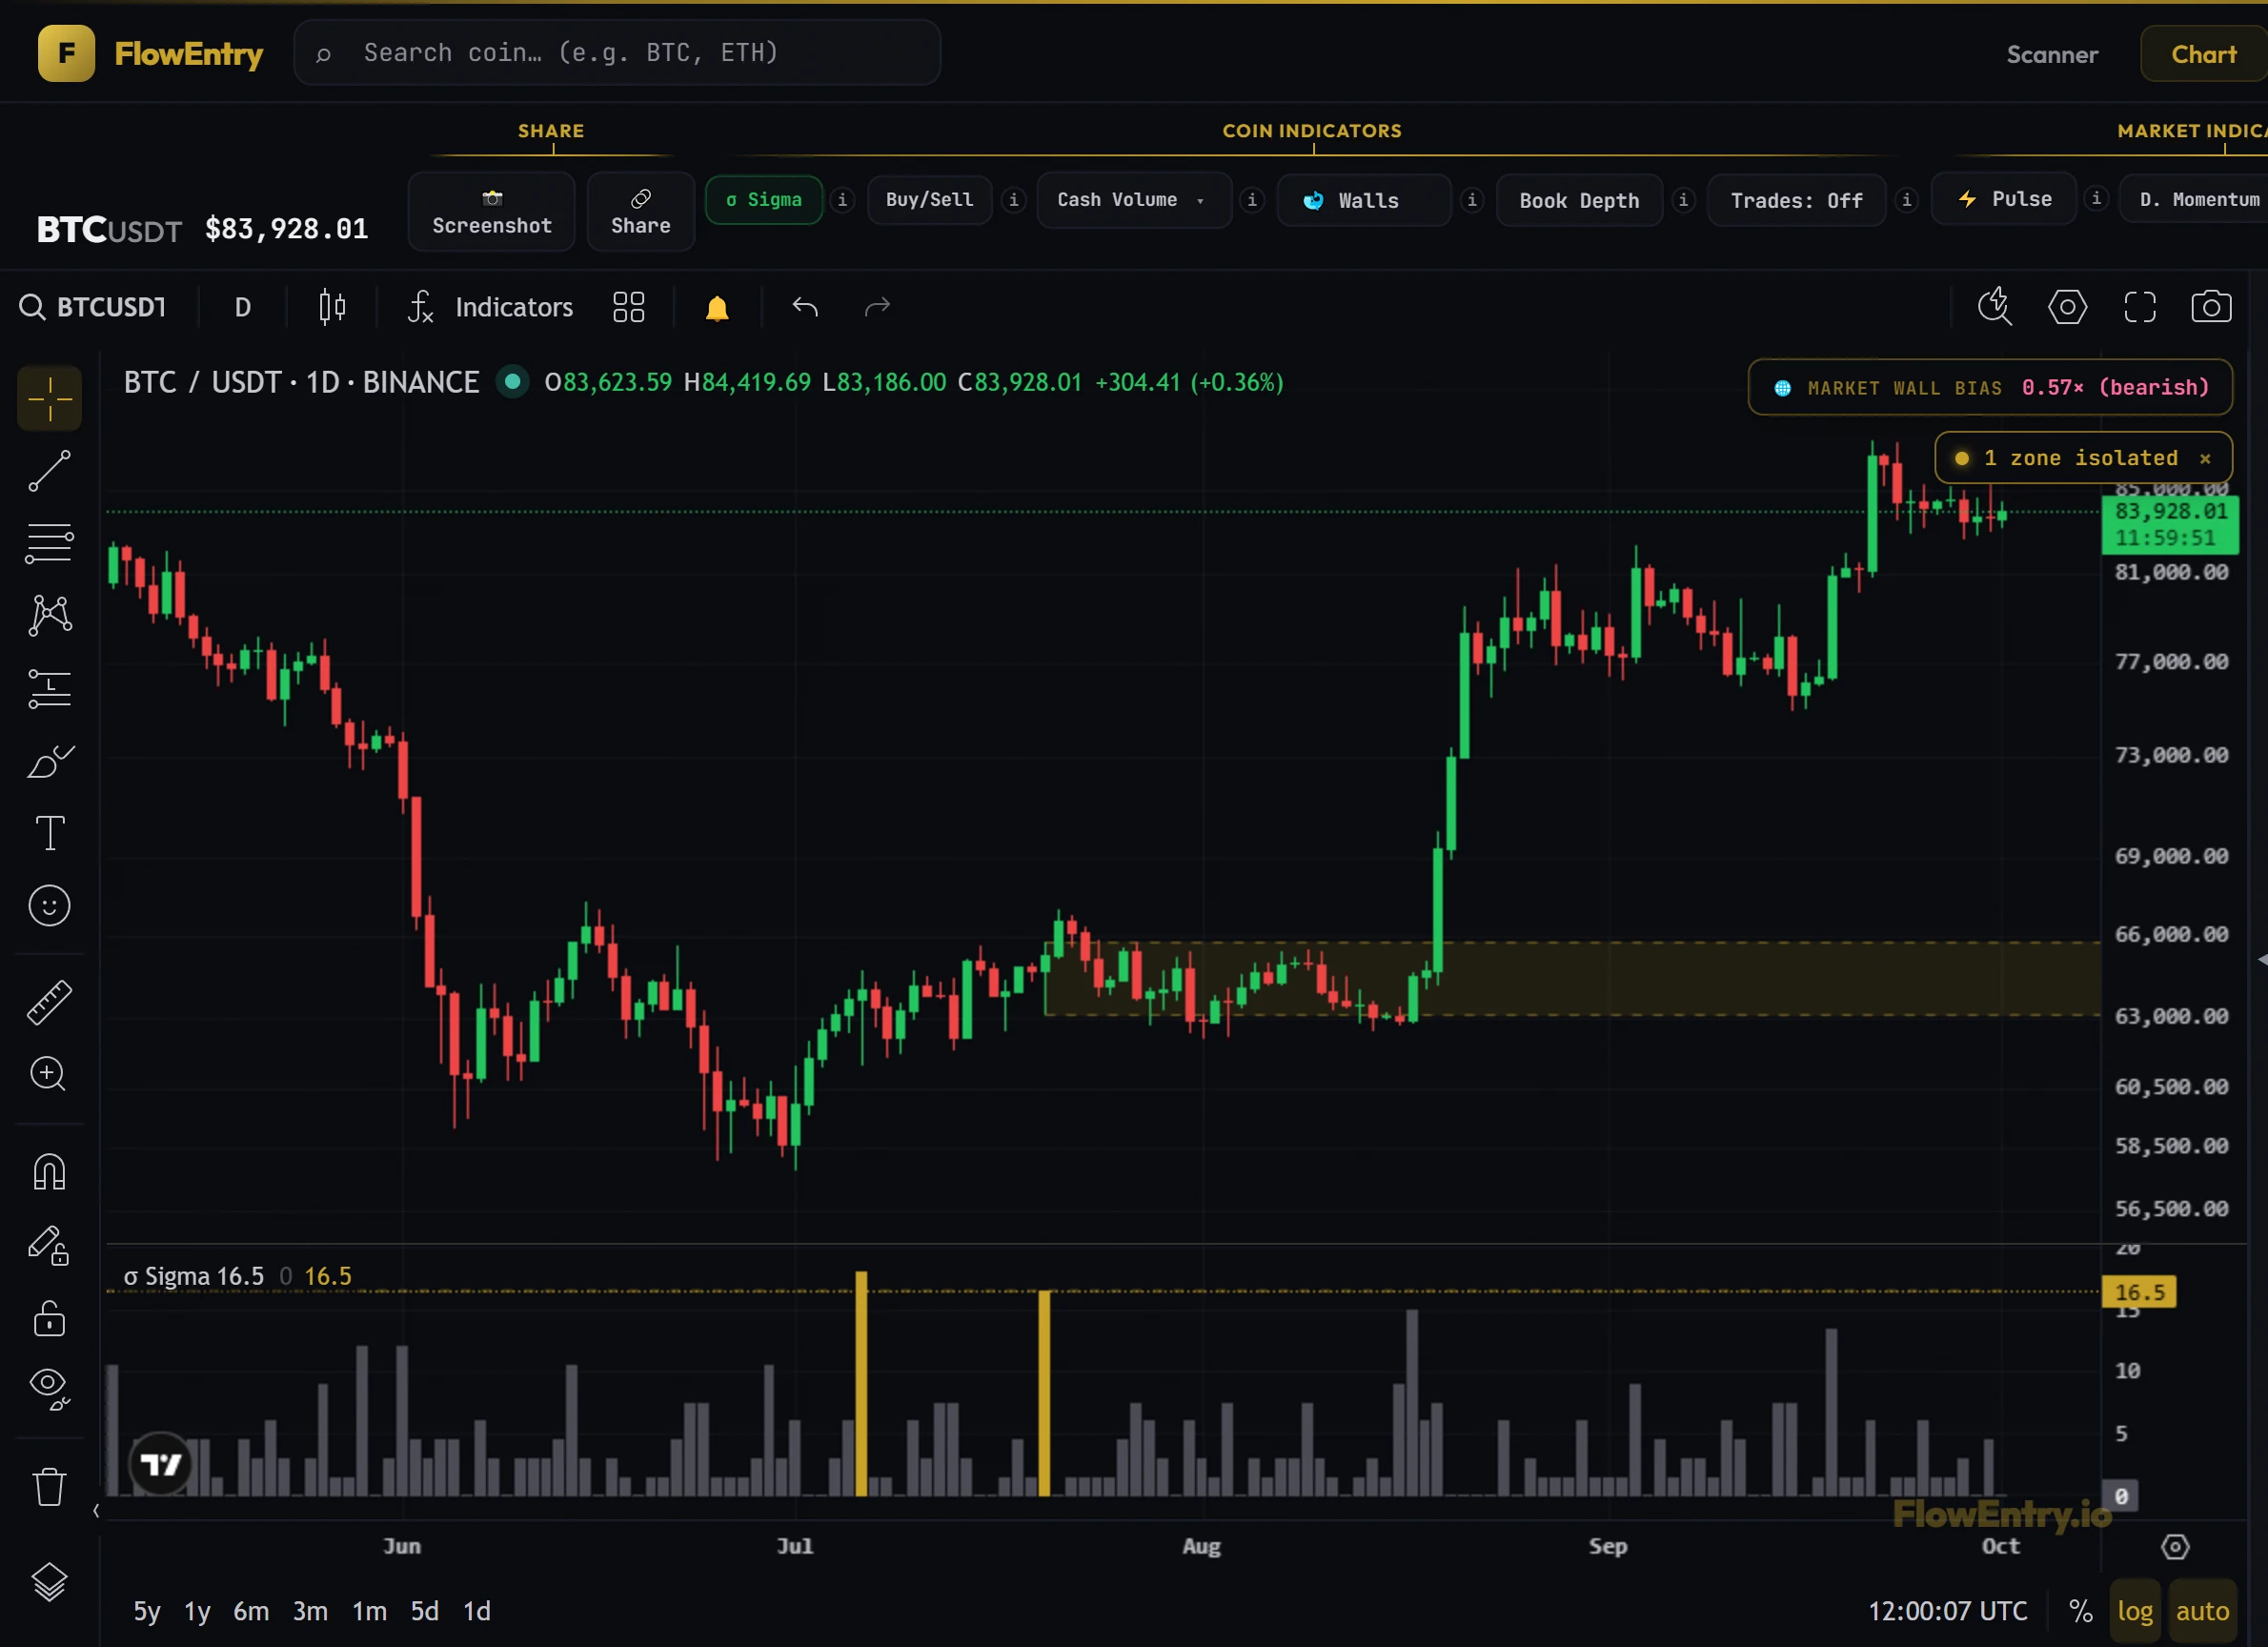
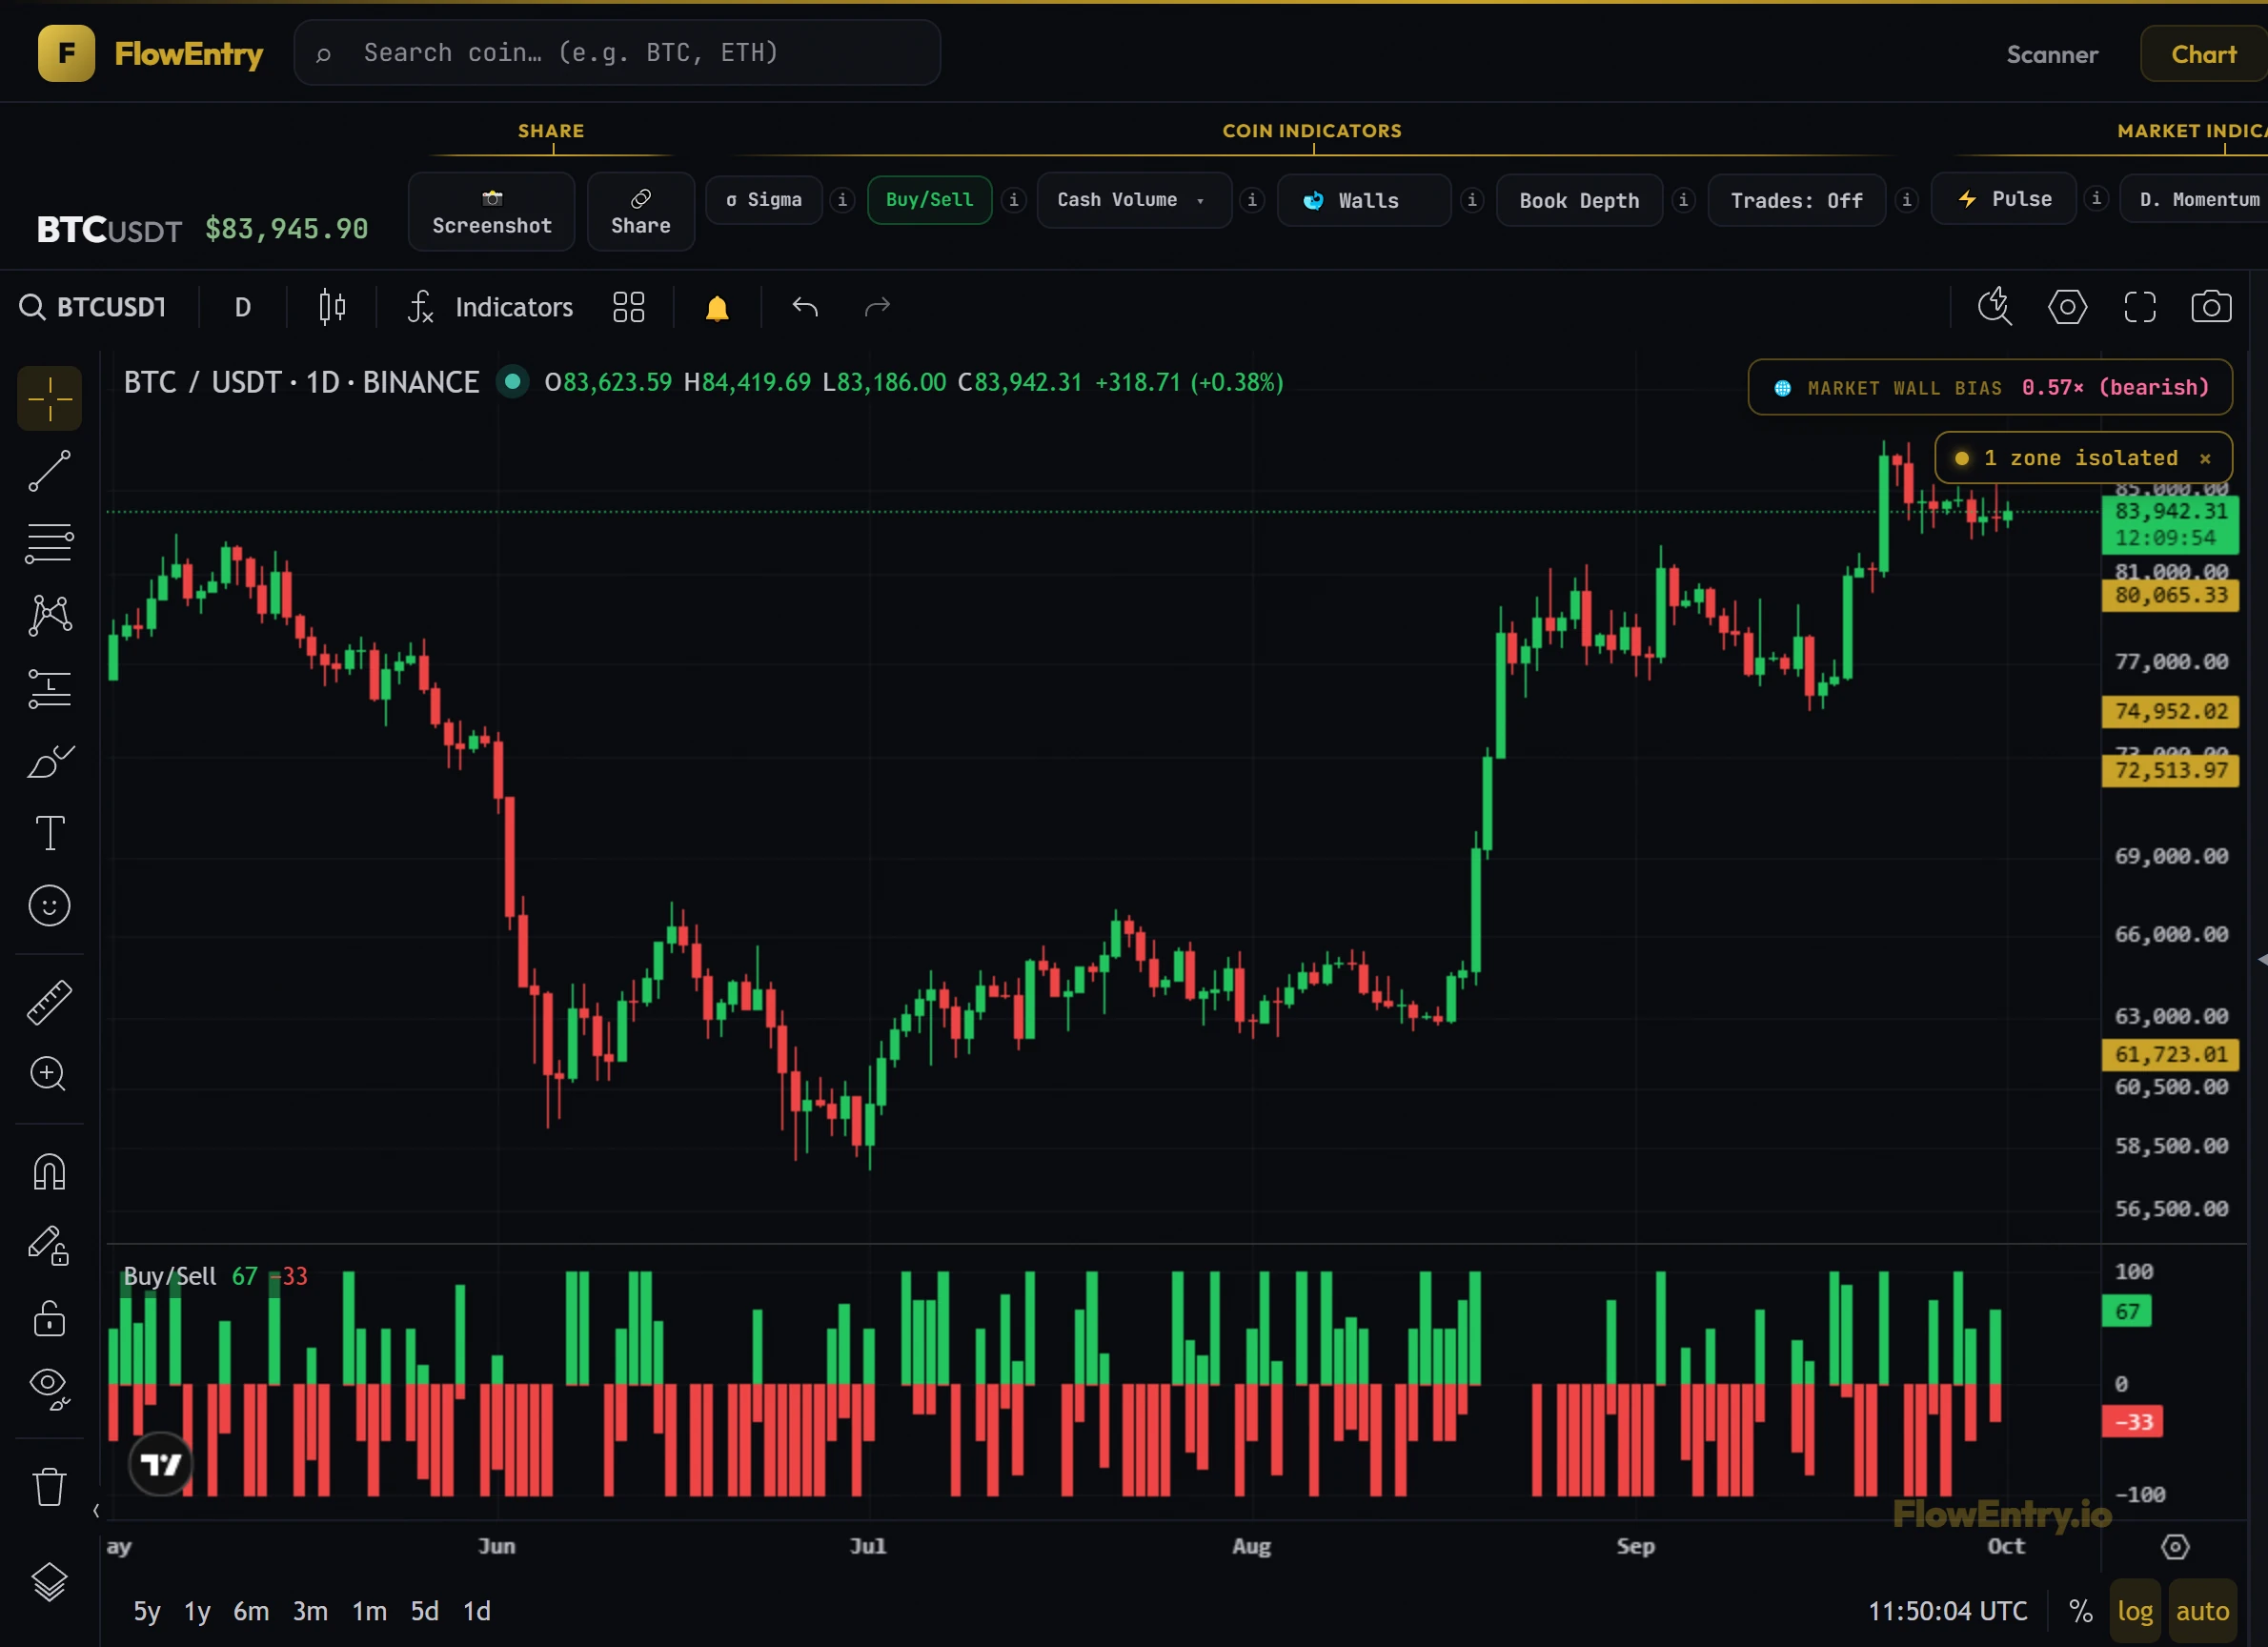
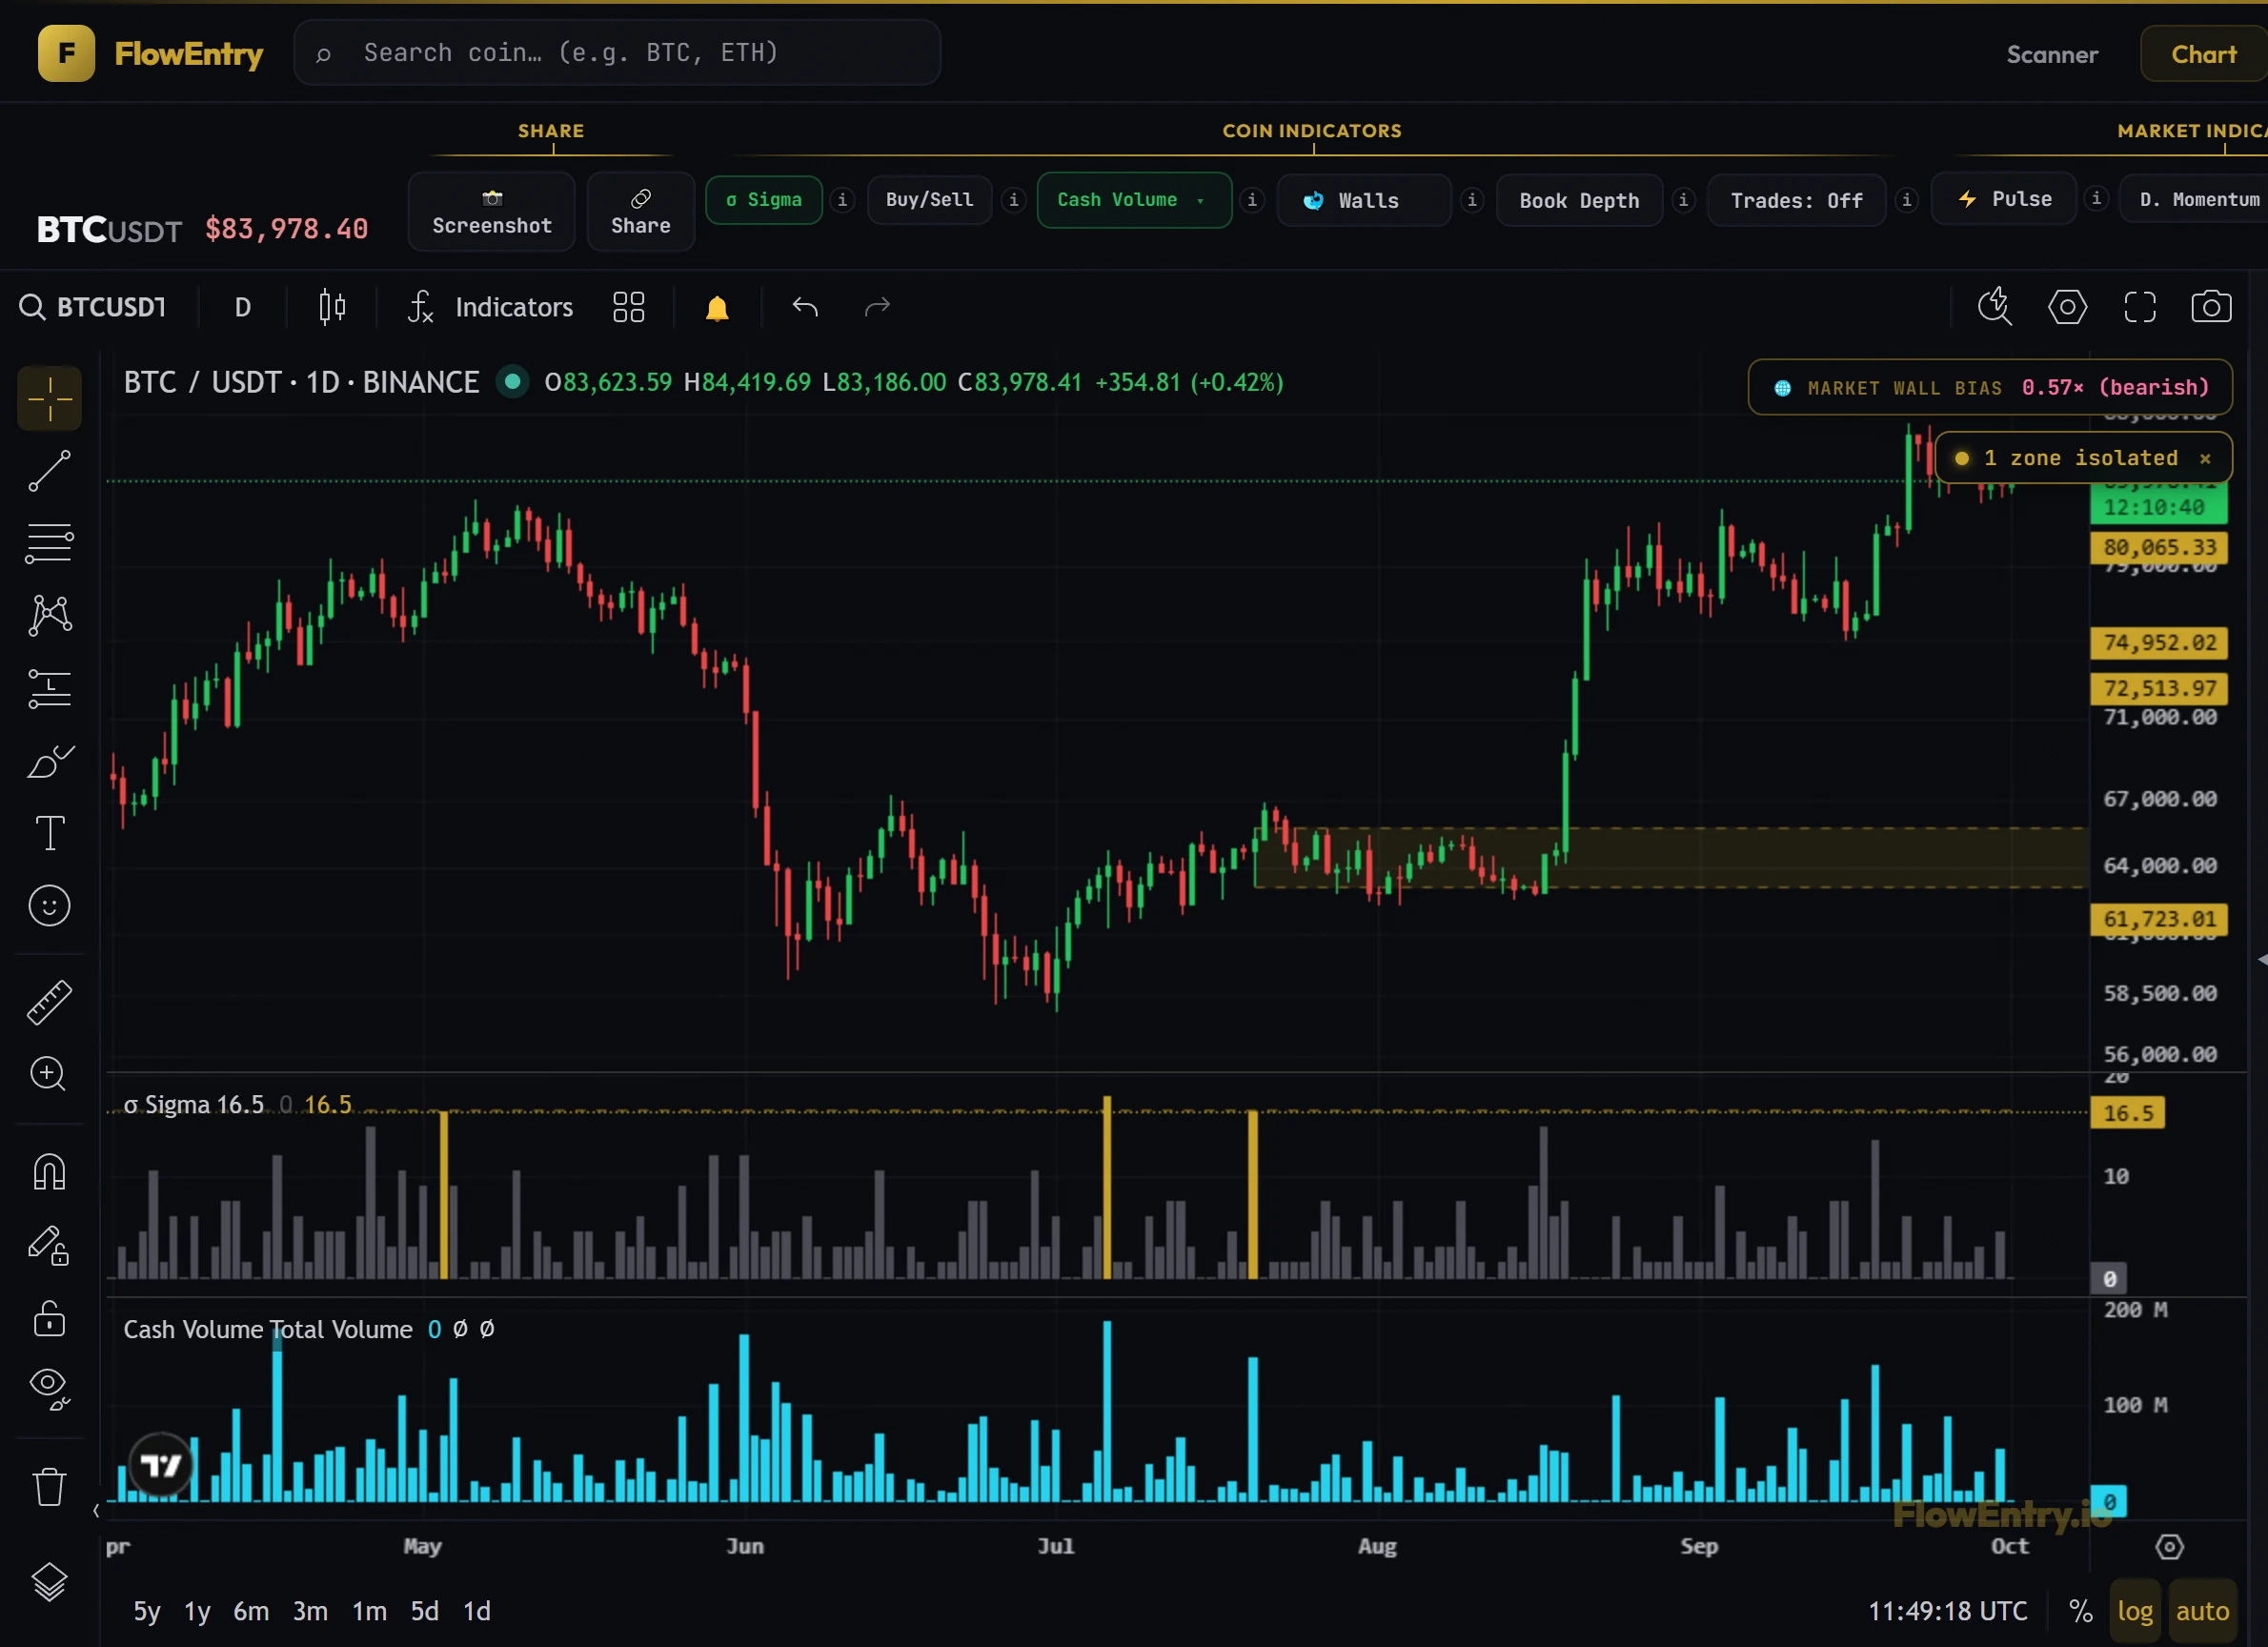
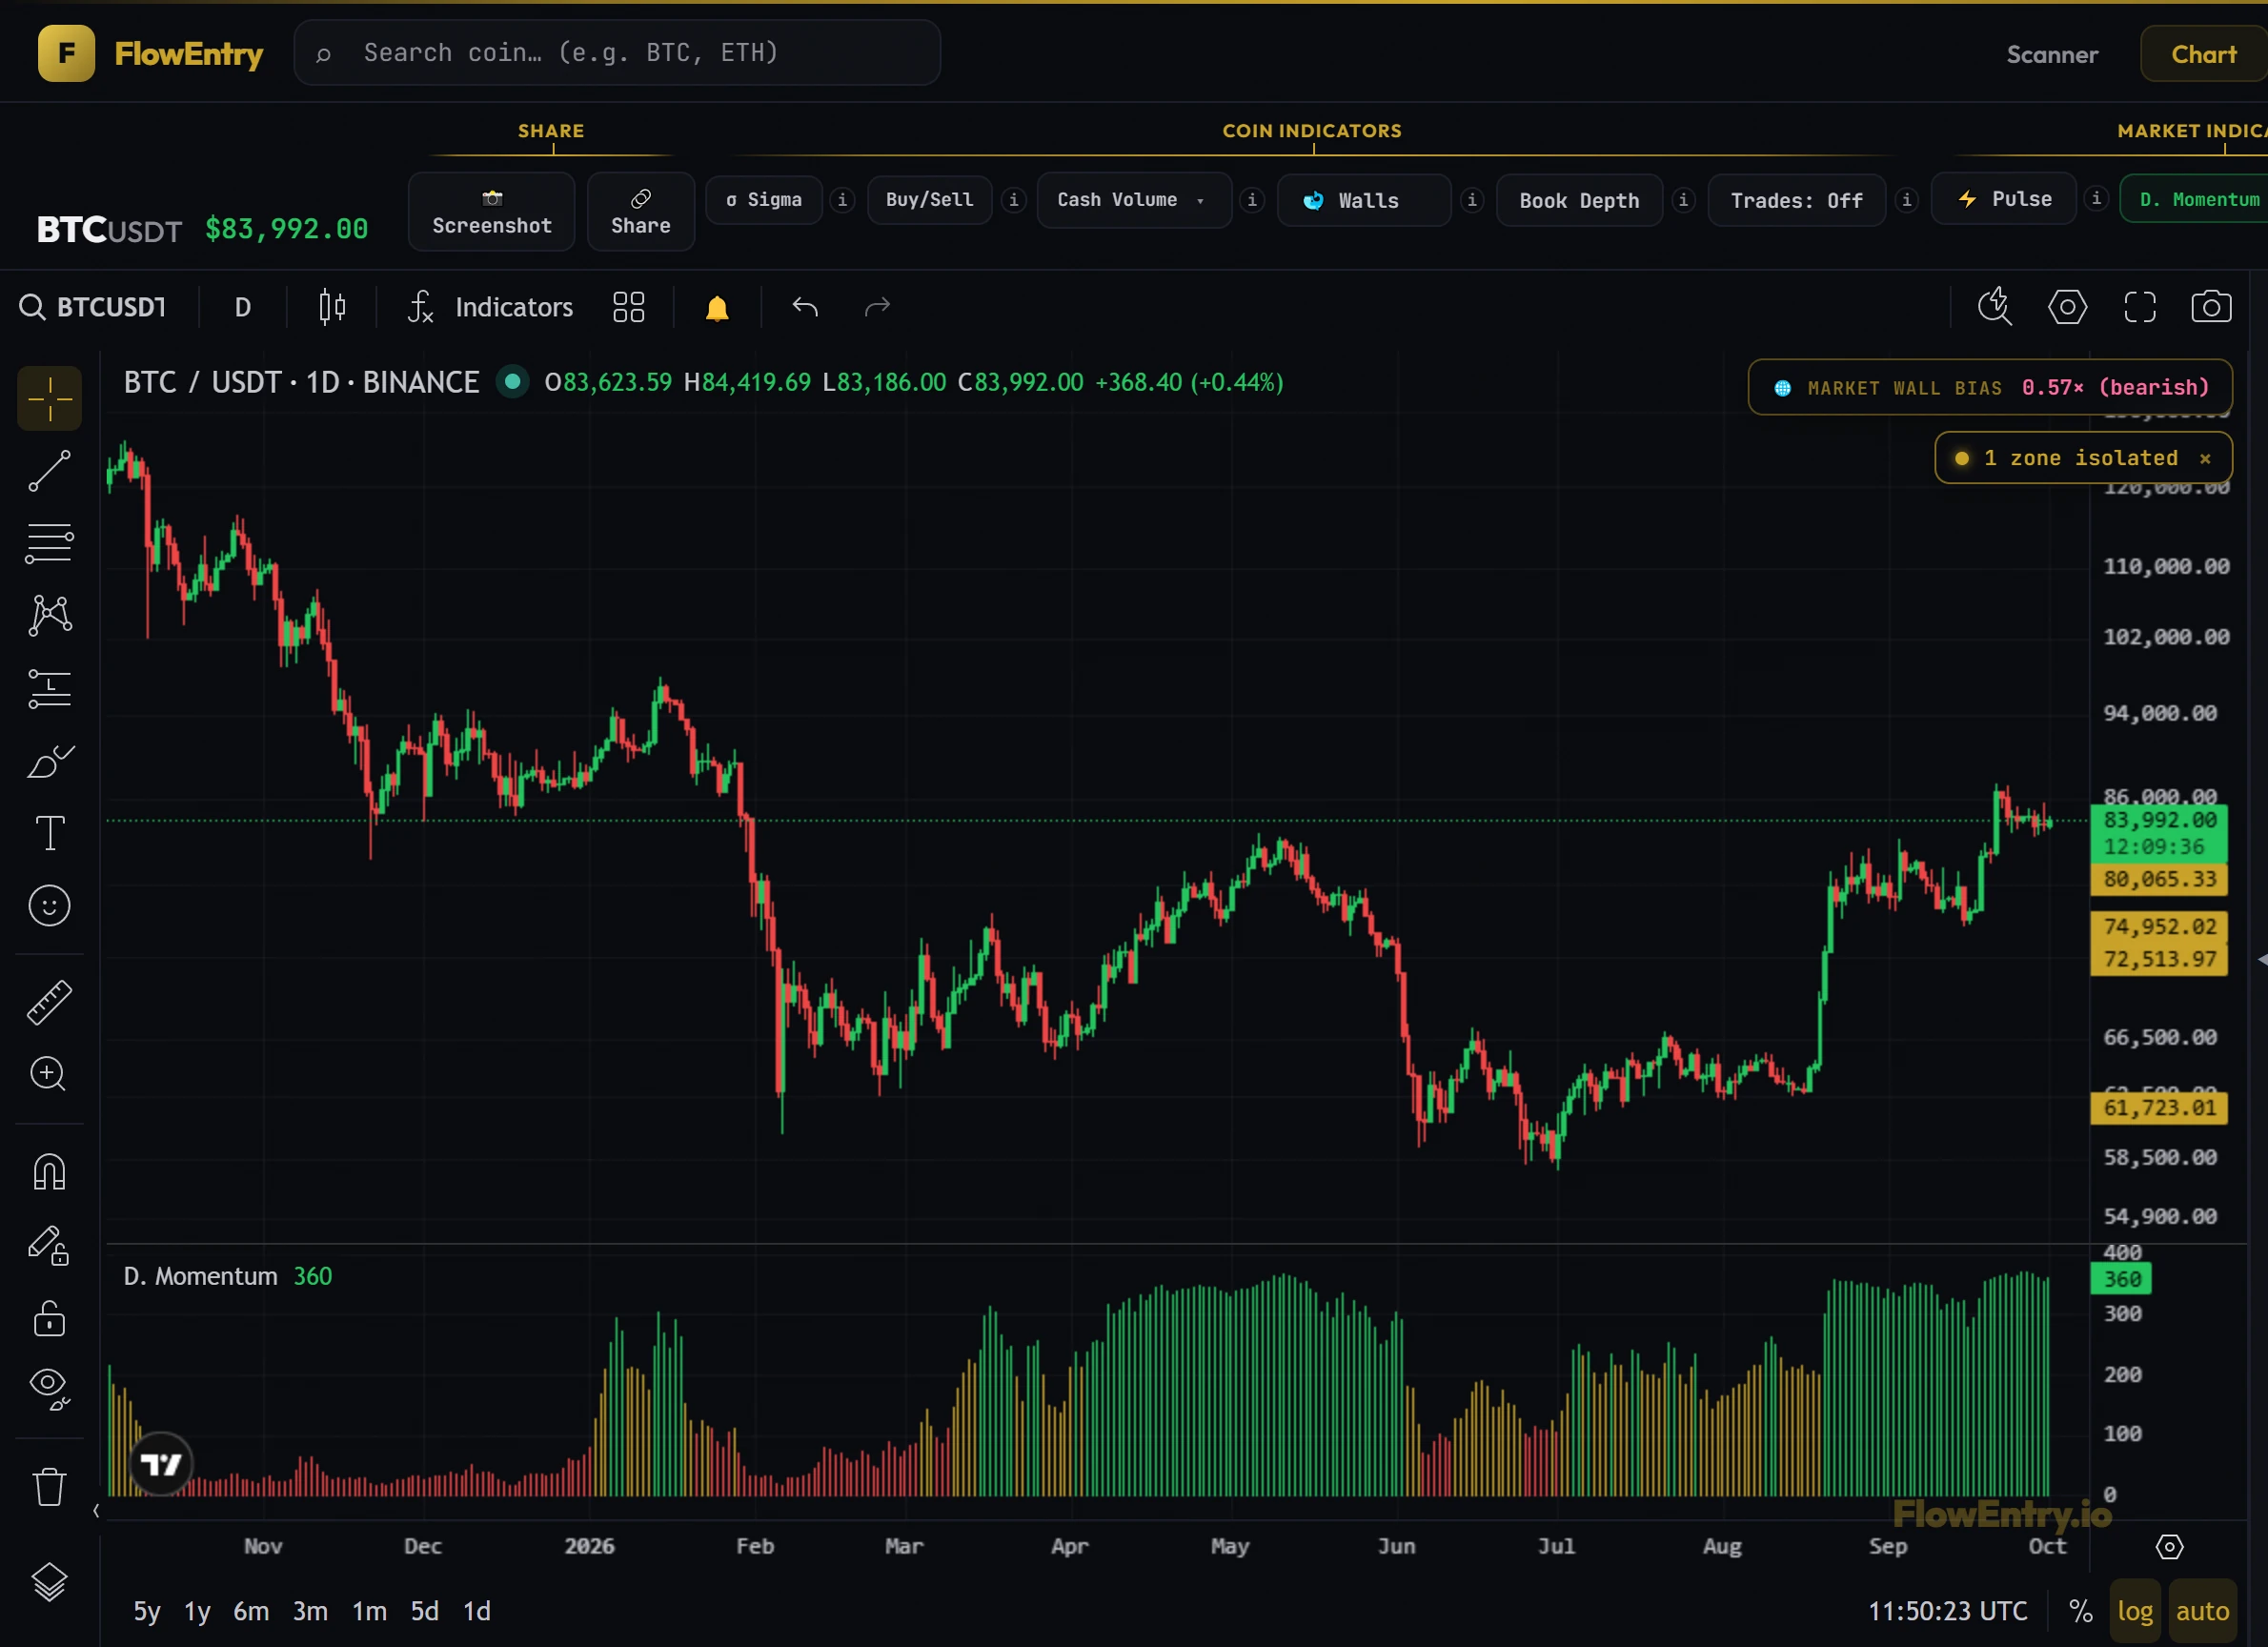
How big was the flow today?
One bar per day for the coin. Gold bars crossed the coin’s own threshold, so a zone is drawn on the chart. Grey bars did not.
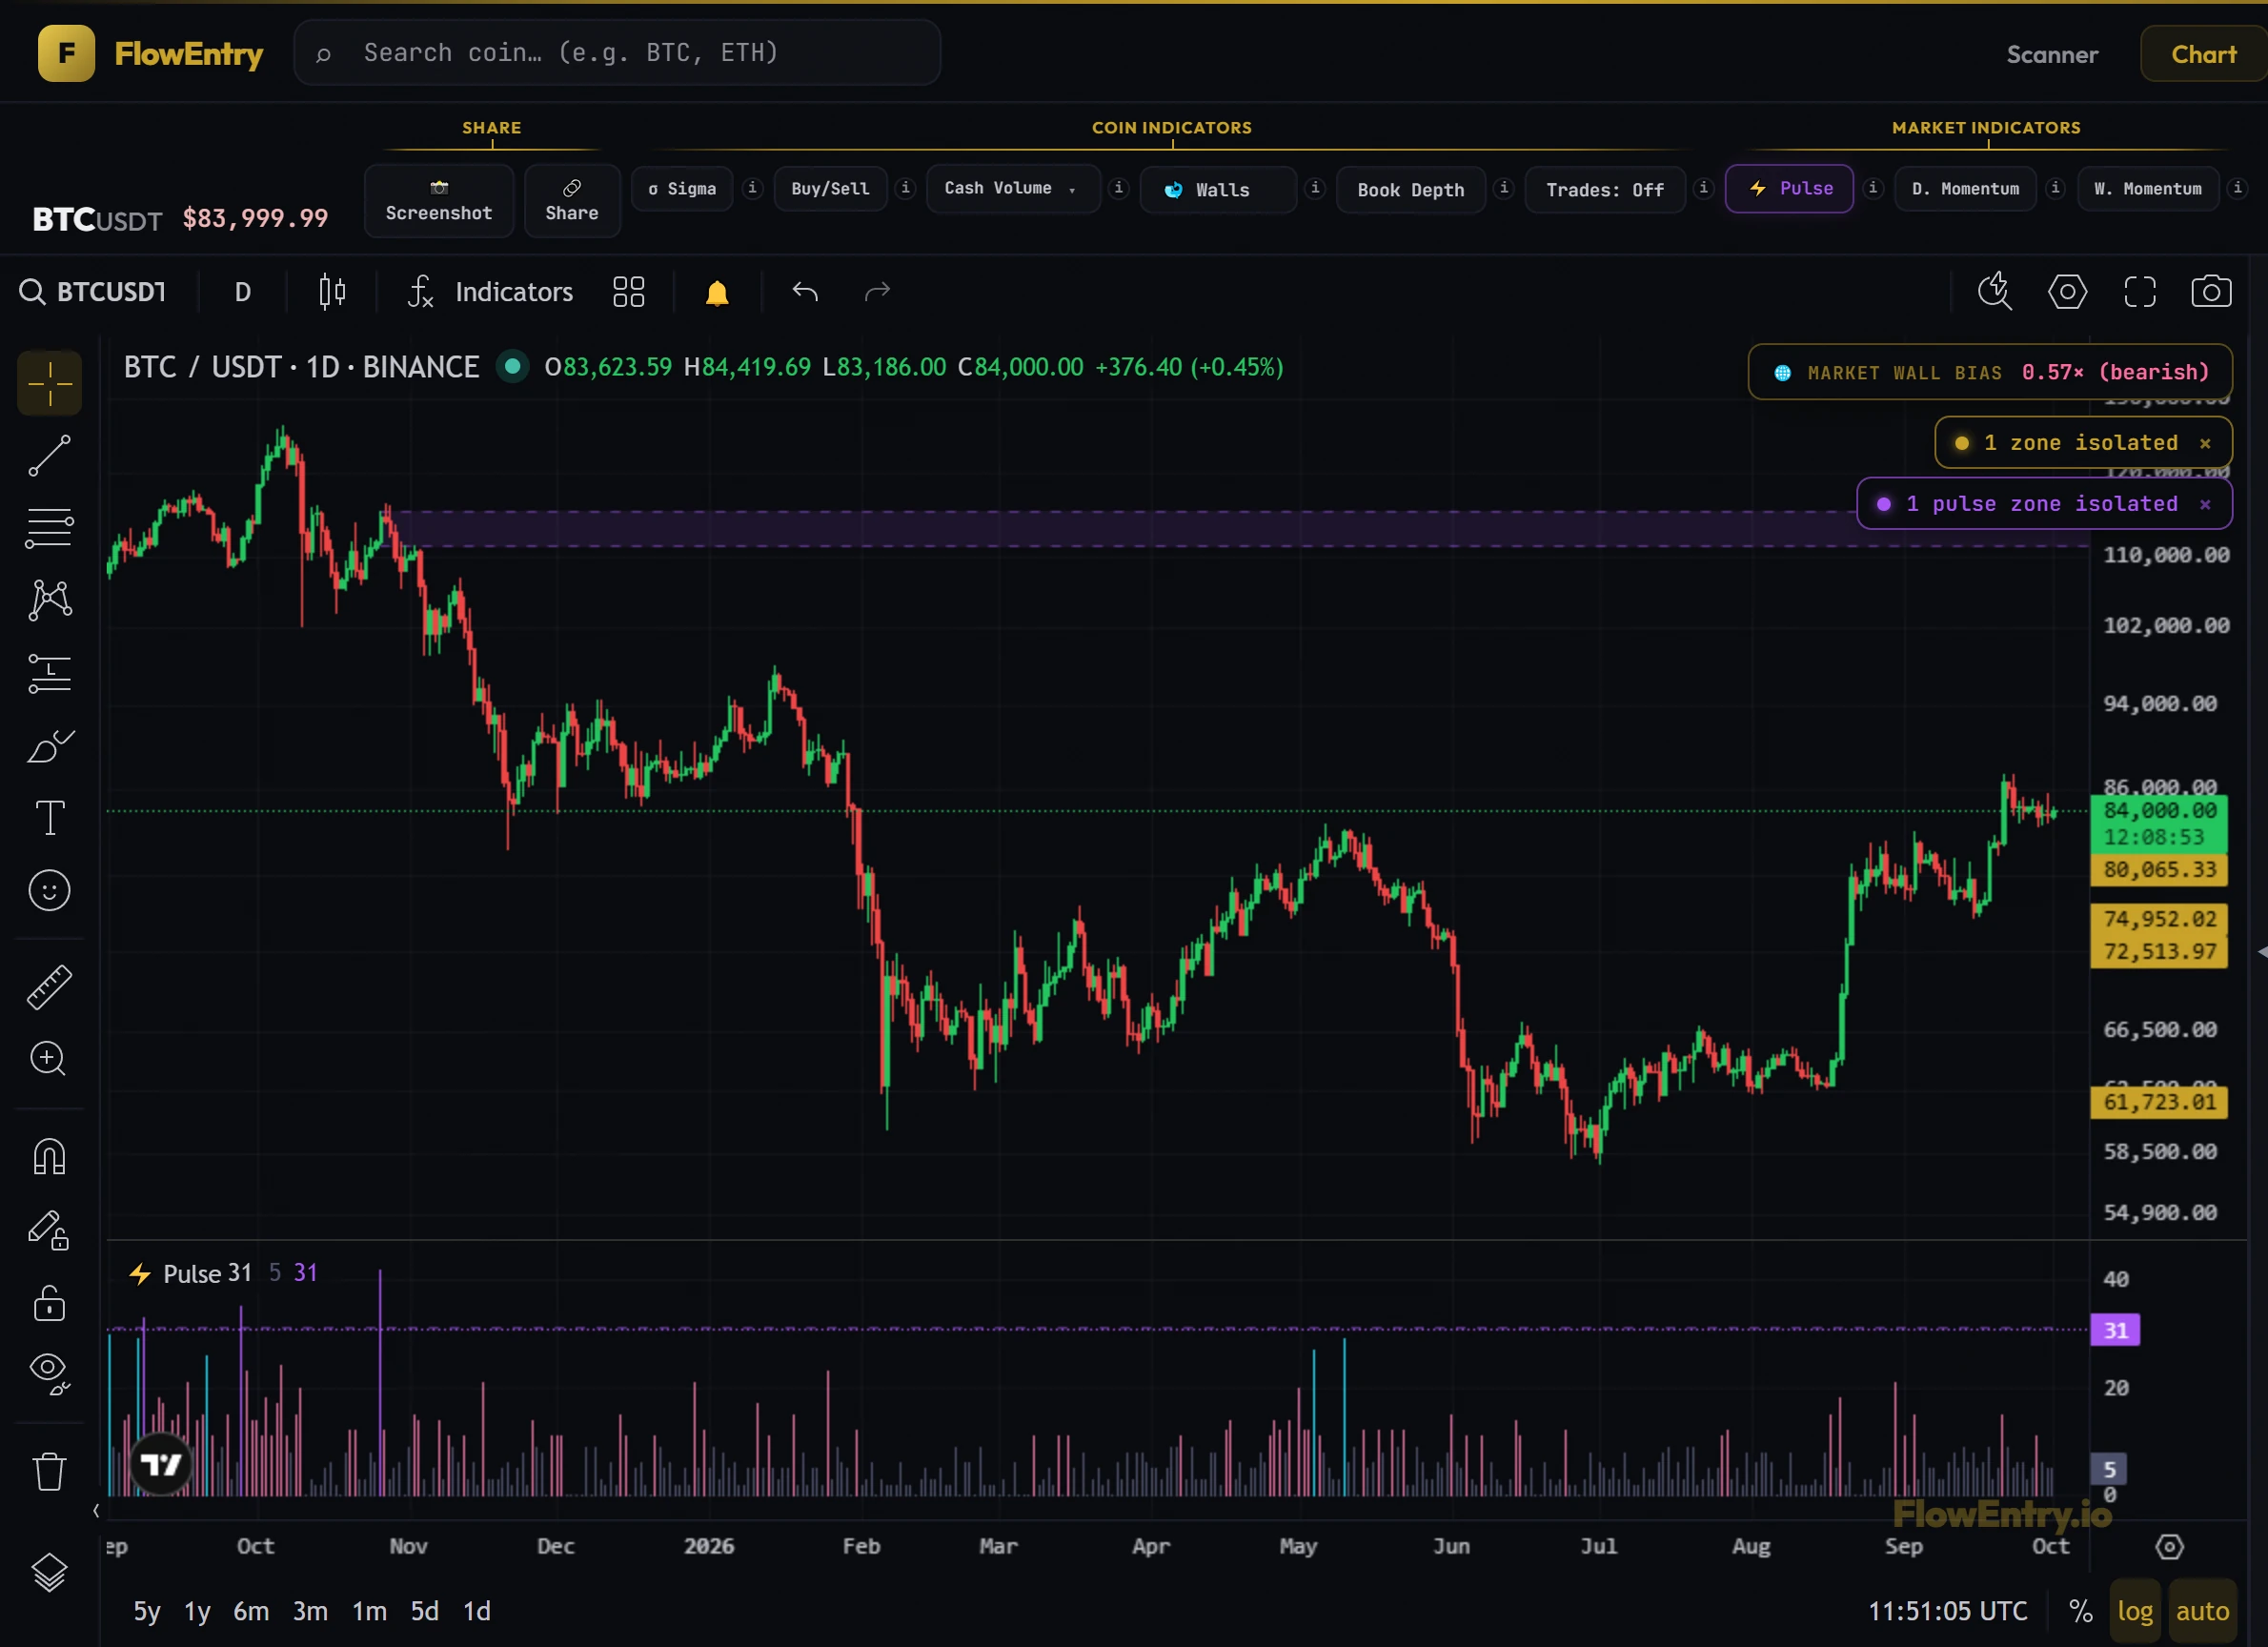
The Pulse
Four years of Pulse, next to Bitcoin.
Each bar is the busiest day of a week: how many coins crossed their threshold at the same time. The line is BTC. Move across the chart and look at where the tall bars sit. Then decide for yourself.
Plans
Start free. Upgrade when you want today's data.
Free shows you the record. Paid shows you what is happening now. Pay with crypto. Nothing renews on its own.
Free
Four years of signal history and every closed trade. Don’t take our word for it. Check the record yourself.
- ✓Every closed trade, wins and losses
- ✓4+ years of chart history (older data)
- ✓Scanner preview (1 coin a day)
- ✓Guided chart tour + Watch and All Pairs tabs
30-Day Pass
Not ready for a year? Use everything for 30 days. Move to Annual when you're sure.
- ✓Full access to all features
- ✓Full scanner (all coins)
- ✓Full History & Real-Time Data
- ✓Cash Volume, Pulse, D. and W. Momentum
- ✓Whale Walls + Book Depth
- ✓Scanner history: Yesterday, 7D, 30D, Custom
- ✓All trades & zones
- ✓Up to 100 active price alerts on Telegram
- ✓Private Telegram channel
Annual
Everything, for a full year. One payment.
- ✓Full access to all features for a year
- ✓Everything in 30-Day Pass
- ✓2 months free vs the 30-Day Pass
- ✓Priority support
Follow along
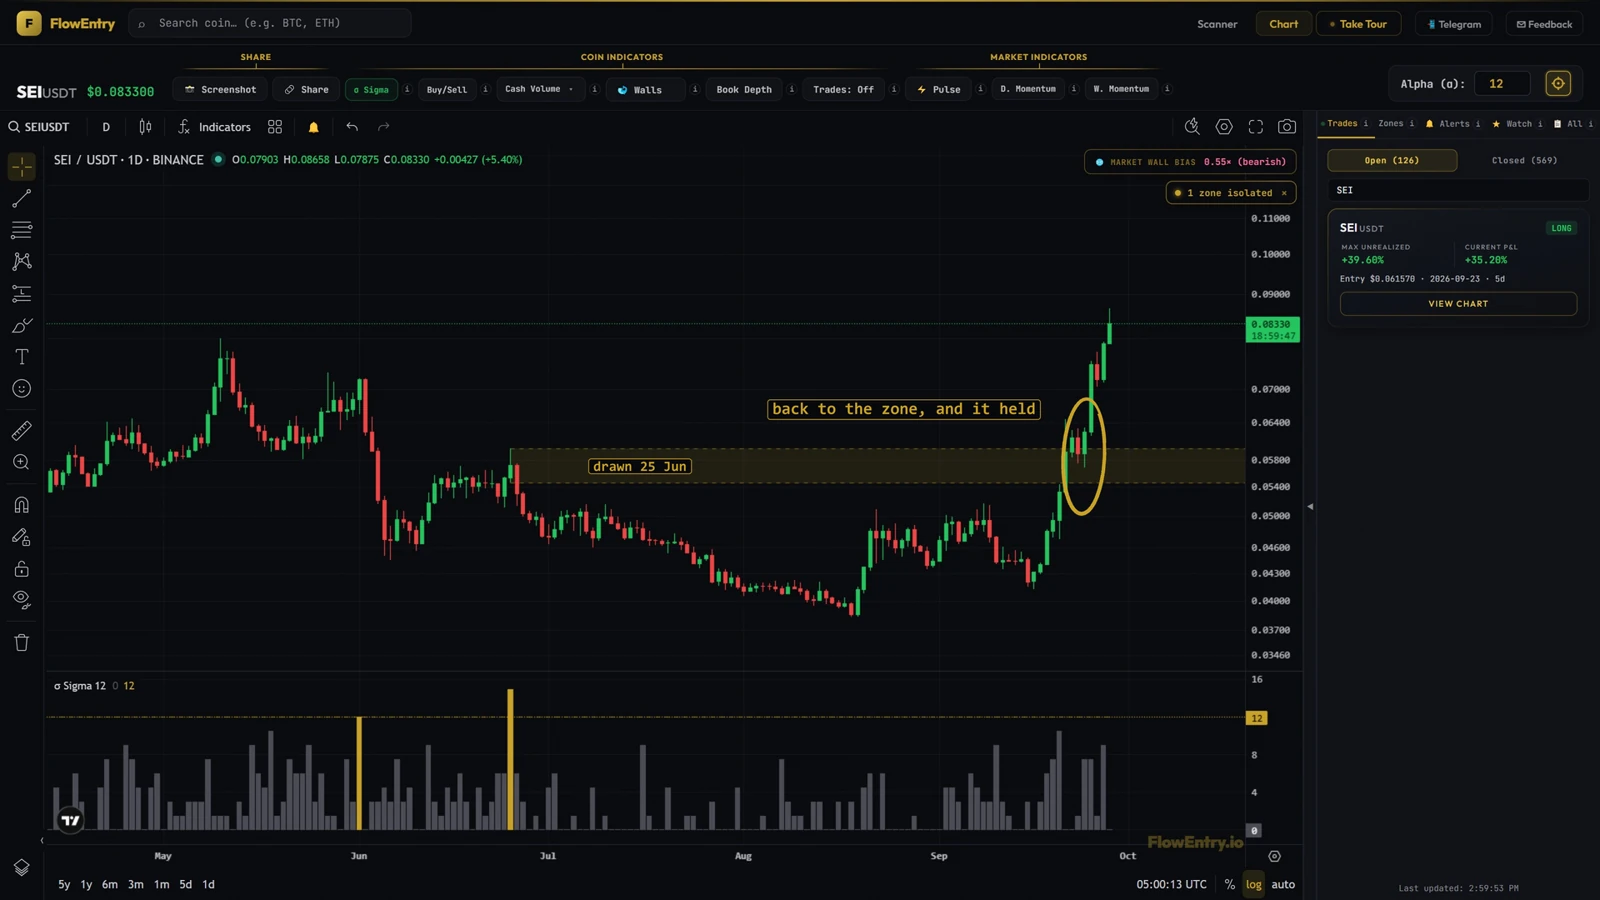
The same charts, posted every day.
Every post is logged and graded later, the ones that worked and the ones that did not.

Questions
- One place. Scanner, chart, eight indicators, whale walls and alerts on one screen.
- A public record. Every closed trade is in the app for anyone to check, wins and losses.
- Four years of history. Flow data since March 2022, so you can scroll back through every market before you decide.
Follow the money. Check it yourself.
Open the chart for free. A short tour shows you around on your first visit.