Coin Indicator
Cash Volume
Sigma tells you something happened. Buy/Sell tells you which side. Cash Volume tells you how much real money was on it.
Total
Buy / Sell

Net
What it answers
- “How big was this day in dollars, on this coin?”
- “On a gold sigma day, how much money was actually buying vs selling?”
- “Is this rally being driven by big real flow, or by a few small unusual prints?”
- “Did the move have one big day of dollar conviction, or is it slowly bleeding in?”
- “Net positive or net negative this week, where is the dollar weight?”
- “Is real money moving through the whole market today, or just this one coin?”
Mental model
If Sigma counts the unusual events and Buy/Sell tells you which side won, Cash Volume tells you how big the cheque was. Three lenses on the same dollars.
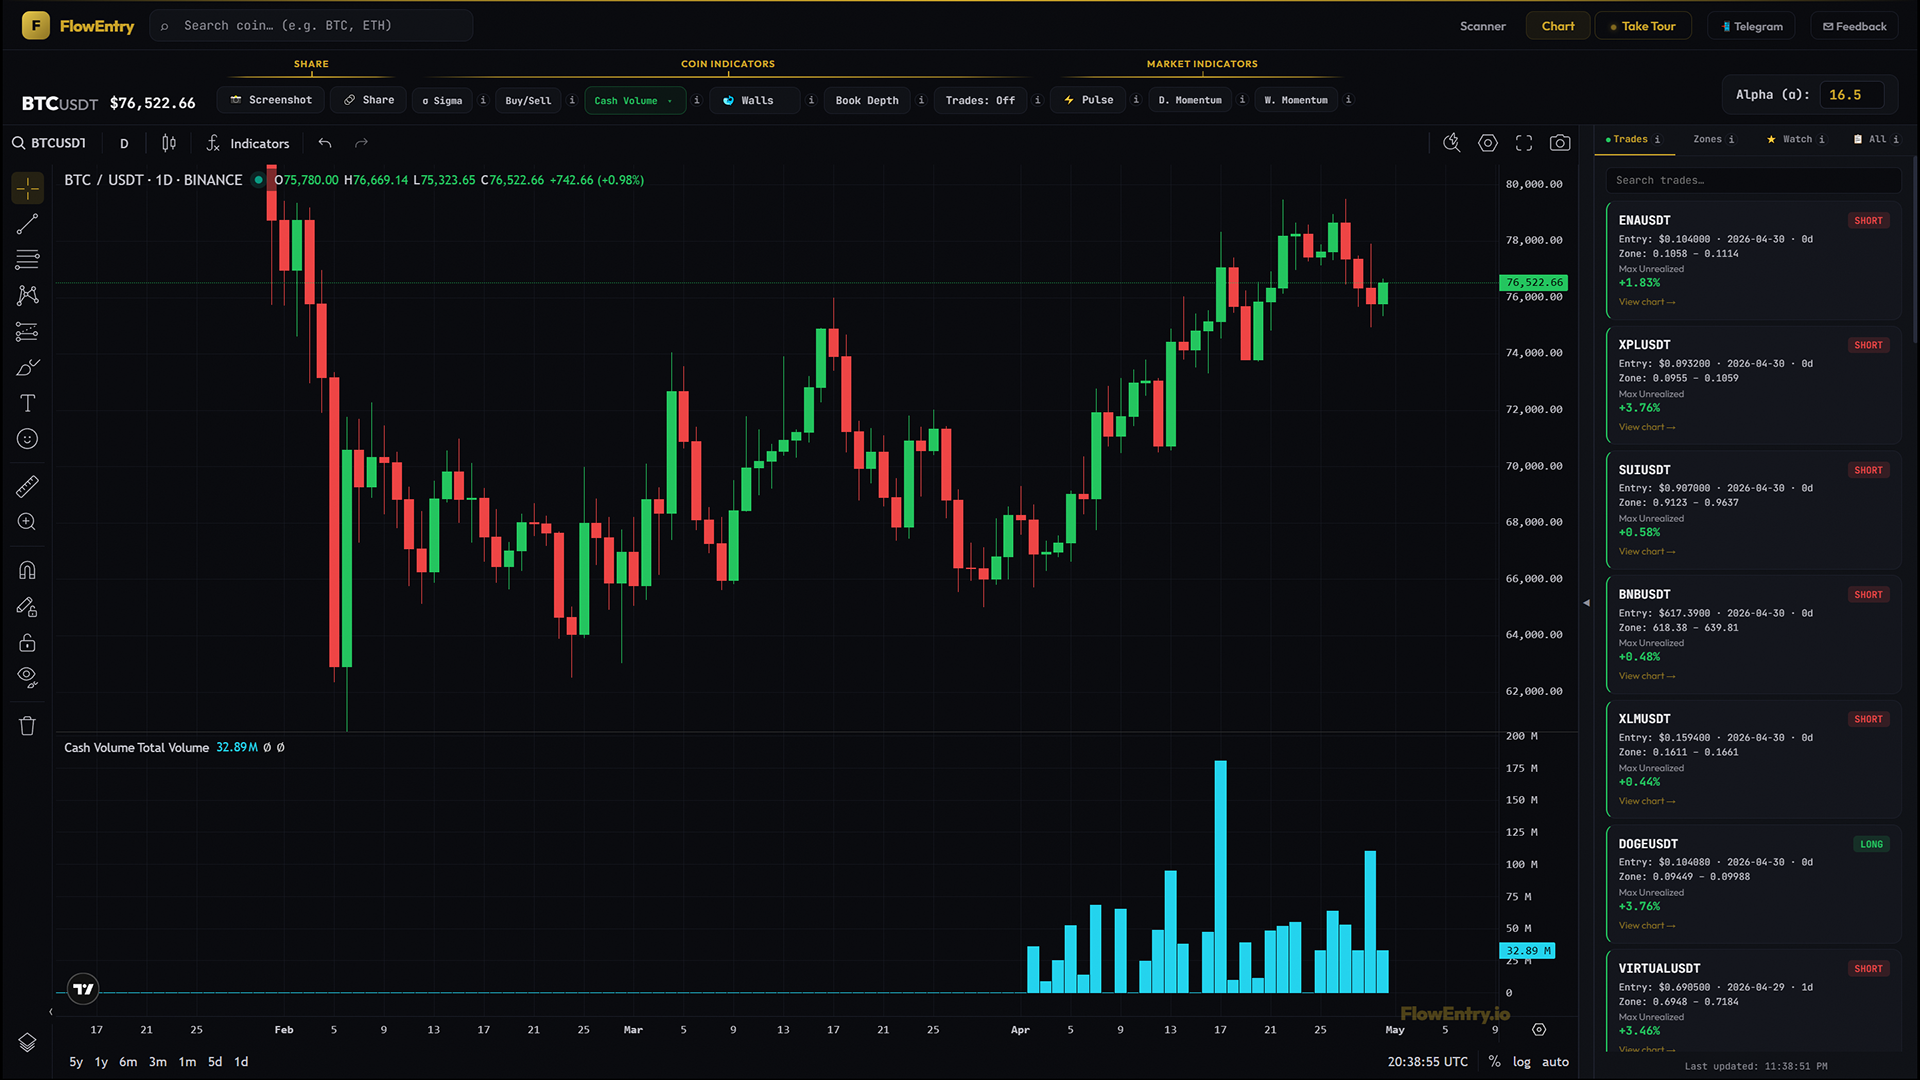
- Total (cyan)How much money flowed through the unusual events on that bar. The size of the day, in dollars.
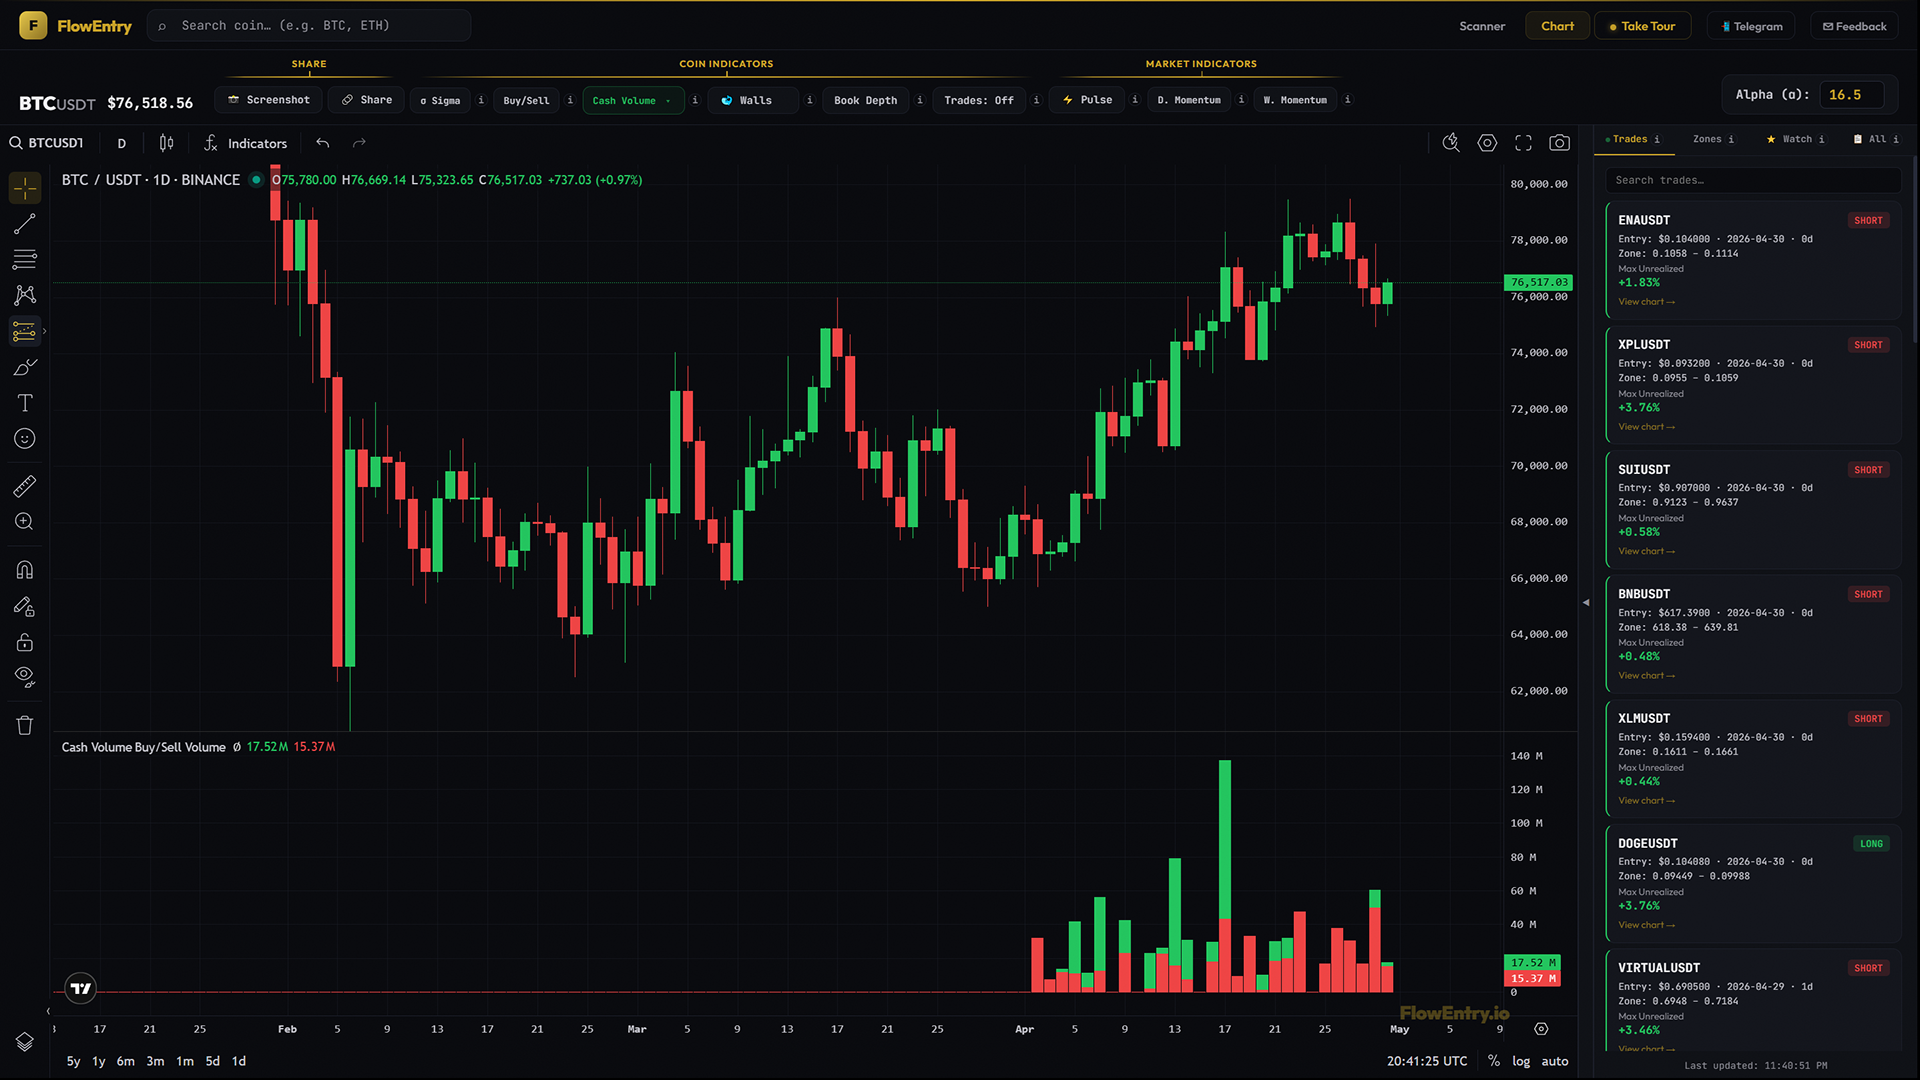
- Buy / Sell (green and red)How the dollars split inside one bar. Green is the buy dollars stacked on top, red is the sell dollars on the bottom, and the whole bar is the two added together. Tall green over short red is real demand, tall red under short green is real supply, both large is a battle.
- Net (green if positive, red if negative)The bottom line of the day. Positive green means buyers won; negative red means sellers won. Useful when you only want one number.
How to use it
- Total mode, size the dayTwo coins with the same Sigma count can have wildly different total dollar volume. The one with the bigger Total bar had the bigger players.
- Total mode, disqualify thin sigmasGold sigma day on a tiny coin with $50k total is not the same as a gold day with $50M total. Total mode lets you weight the signal by the dollars behind it.
- Buy / Sell mode, confirm absorption or exhaustionSigma gold, Buy/Sell red dominant in events, but Cash Volume Buy/Sell shows green dollars meeting red dollars roughly evenly. The count is being driven by sellers but the dollars are being absorbed by buyers. That is hidden absorption. The reverse flags hidden distribution.
- Buy / Sell mode, wash-trade filterBig total bars with near-equal green and red, day after day, on a coin with no real news. Likely market-maker churn or wash trading. Real flow is asymmetric.
- Net mode, bottom-line a weekScroll across many days. Are most days net green or net red? That is the dollar weight of the trend, irrespective of price action.
- Net mode, spot the day that broke the trendA run of net green followed by a single very large net red. One big seller stepped in. That bar is worth investigating.
The natural workflow is the three-indicator loop. Sigma to find the gold day, Buy/Sell to read the direction of the events, Cash Volume to weight the signal in dollars. Together they give you count, direction, and size.
This Coin and Entire Market
A scope switch sits at the top of the Cash Volume dropdown. This Coin shows the dollars for the symbol on your chart. Entire Market sums the same dollars across every USDT pair at once, with stablecoins left out.
The three modes work exactly the same in both scopes. Total is the market-wide dollar flow, Buy/Sell is how that flow splits, Net is the market-wide bottom line. Think of it as the dollar-weight companion to Pulse. Pulse tells you how many coins fired, Entire Market Cash Volume tells you how much money was behind them.
One thing to be clear about. This is the dollar volume FlowEntry recorded during detected liquidity events across the market, not the total traded volume of the market. It is the same event-filtered basis as the single-coin view, just added up.
Entire Market runs on the Daily, Weekly and Monthly timeframes only, because a market-wide sum is a per-day figure. On a lower timeframe it stays off and tells you so, the same way Pulse does.
What it doesn’t do, and when not to use it
Below 4H timeframe is blocked by design. Sub-4H buckets are too noisy to be meaningful. On intraday timeframes (4H to 12H) only the last 14 days of data are fetched, useful for recent context, not for historical study. On 1D and above you get full history.
For coins with no recent activity, no events means no dollar rows means no bars. Cash Volume is a flow indicator, not a price indicator.
Why it works
Dollars don’t lie about size. Counts can be inflated by market-maker spam, retail noise, or thin-book wicks. Real positioning shows up in the dollar value of the events, not just their number. Cash Volume turns “lots of activity” into “X million dollars one-sided”, and the difference between those two statements is the whole game.
Examples
Case A, real demand vs noise sigma
- Setup.
- Two coins both print gold Sigma on the same day.
- Signal.
- Coin A, Total bar $30M, Net heavily green. Coin B, Total bar $400k, Net green.
- Outcome.
- Coin A continued; Coin B stalled.
- Lesson.
- Same Sigma, very different cheque size. Trade the cheque.
Case B, hidden absorption
- Setup.
- A coin holding a level despite three days of gold Sigma plus heavy red Buy/Sell.
- Signal.
- Cash Volume Buy/Sell shows green dollars matching red dollars roughly one to one.
- Outcome.
- Sellers run out; price reverses up.
- Lesson.
- Count says “sellers winning”; dollars say “absorbed”. Trust the dollars.
Case C, distribution into a top
- Setup.
- A coin run-up over many days, mostly net-green Cash Volume.
- Signal.
- Two consecutive gold Sigma days where Net flips red on rising prices.
- Outcome.
- Top inside a week.
- Lesson.
- When dollars turn negative while price drifts up, retail is buying late.
Case D, wash-trade filter
- Setup.
- Small-cap coin with daily gold Sigma and big Total bars.
- Signal.
- Cash Volume Buy/Sell shows green and red roughly equal, every day, with Net hovering near zero.
- Outcome.
- Price went nowhere; eventually delisted.
- Lesson.
- Symmetric flow with no net direction across many days is manufactured activity. Move on.