Coin Indicator
Sigma (σ)
Sigma shows you, every day, which coins had real money quietly moving, before the chart shows you why.
What it answers
- “Is anything actually happening on this coin today, or is it dead?”
- “Was that breakout backed by real flow, or was it noise?”
- “Where did smart money enter on this chart?”
- “Out of 600 pairs, which 5 should I look at right now?”
- “Is this run-up still being accumulated, or is it being distributed?”
Mental model
Sigma counts unusual flow events on a coin, one event per detection. A single event is one moment where buyers or sellers clearly took control of the tape on that coin, in real money. Most coins have a small handful of these on a normal day. When a coin suddenly stacks up fifteen, twenty, forty in a single day, far above what that specific coin usually produces, that is the unusual of the unusual.
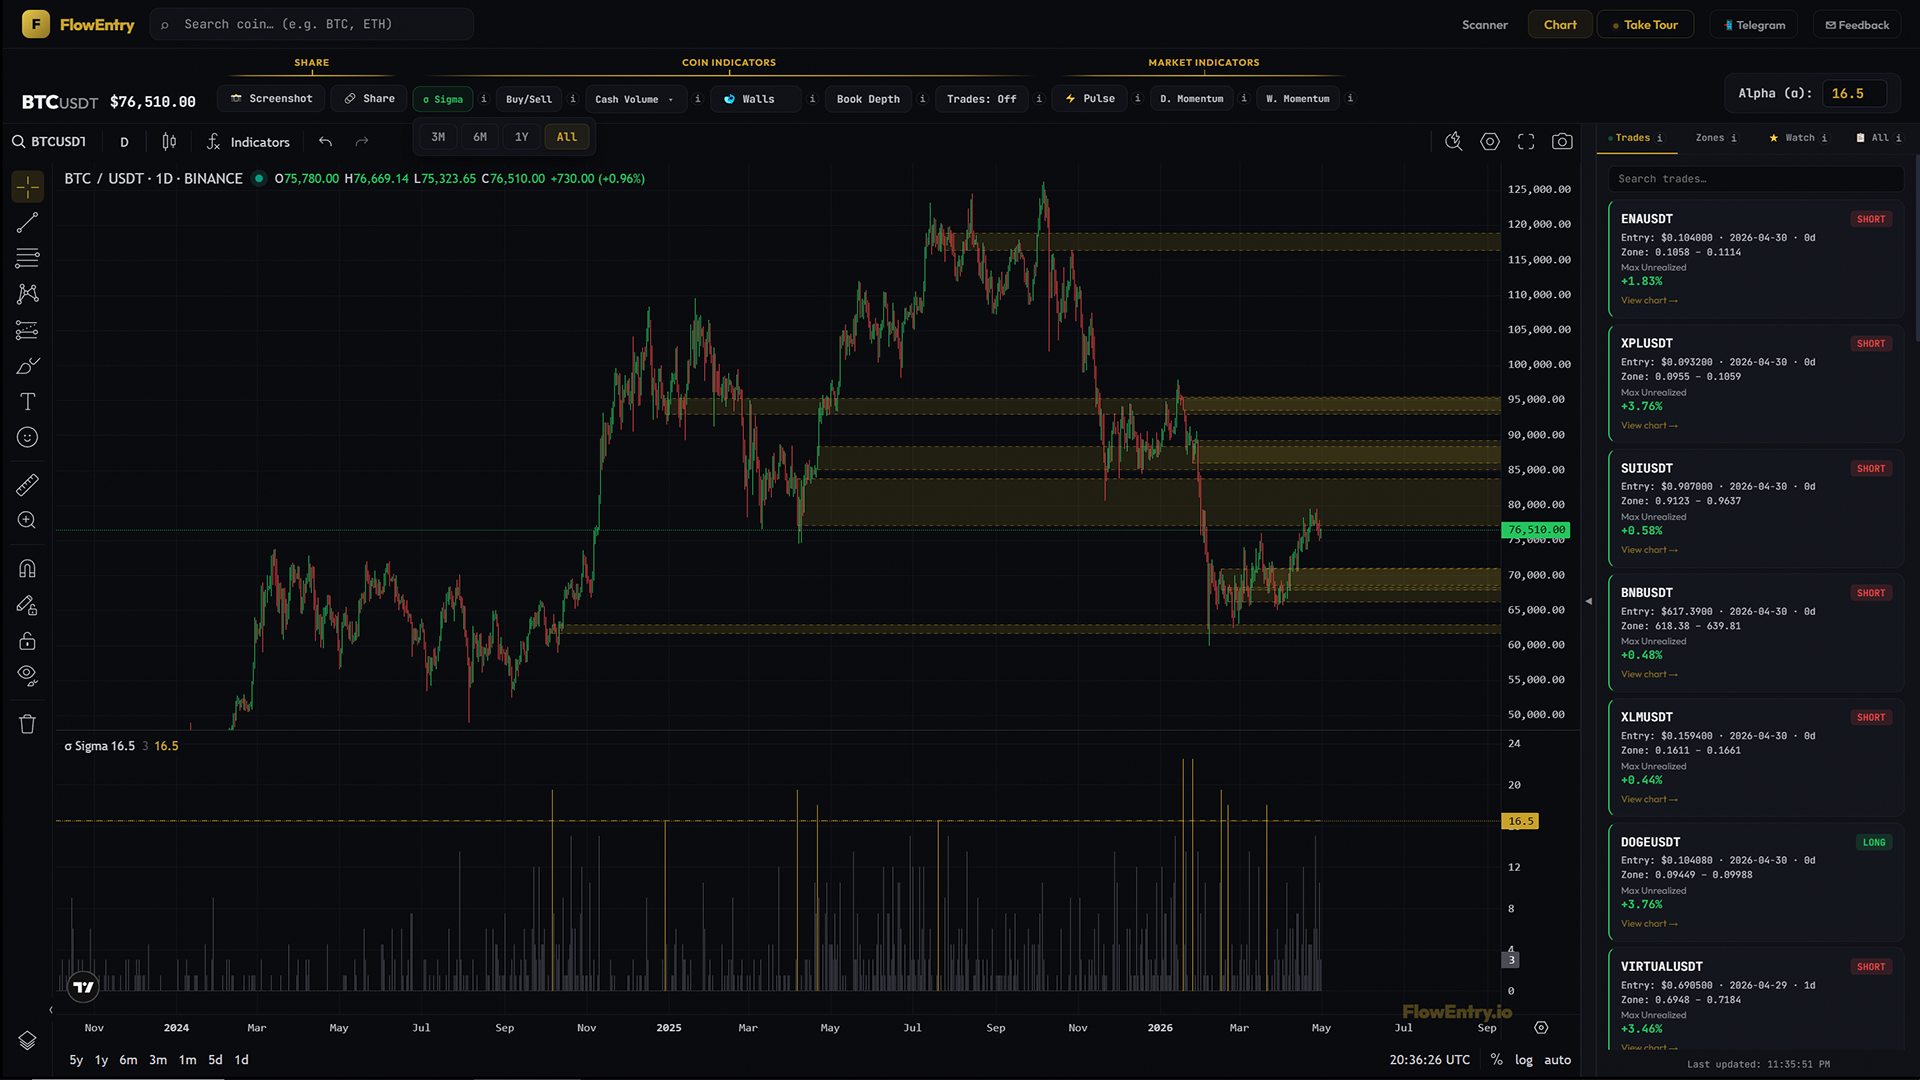
Alpha is the line where “active” becomes “abnormal”, and it is calibrated per coin, because what is normal for BTC is not normal for a small-cap. Cross that line and the bar turns gold. Cross it and a zone gets drawn on the price chart at that day’s range. The zone is where the money showed up.
You don’t read order books. You don’t write scripts. You watch the gold.
How to use it
- Spot accumulation before a moveA coin printing gold sigma for 2 to 3 days after a downtrend or inside a long sideways range means something is being built. Look at it before it moves, not after.
- Confirm a setup has institutional backingYou already like the pattern. Gold sigma on the breakout day means real money is involved. Gray sigma means retail noise. Size accordingly.
- Filter the universeOpen the Scanner. The hot tiles are the only coins with real flow today. The rest can wait. 600 pairs become 10.
- Time entries inside gold zonesA gold zone marks where smart money entered that day. When price breaks out of the zone and closes daily outside it, that confirms which way the dominant side was actually positioned. Returns to the zone tend to act as support after an upward break, or resistance after a downward one.
- Spot distributionGold sigma after a strong run-up often means smart money is taking profit into retail demand. Time to leave, not to chase.
- Focus on one zoneWhen you want to study a single historical zone without the rest of the chart’s gold zones in the way, right-click that gold bar and choose “Isolate this zone”. Only that zone stays visible. Right-click another to add it; right-click an isolated one to remove it. Or click the gold target icon next to Alpha to open a picker listing every zone-qualifying day in history with date, sigma value, and an “Only” shortcut per row. The range pill no longer matters while isolated — you can pin a zone from years ago and study it on the 3M view. A gold chip below the Market Wall Bias tag shows how many zones are pinned; click the ✕ to return to “show all”.
What it doesn’t do, and when not to use it
Daily timeframe and above only. Sigma counts events per UTC day. Putting your chart on 4H, 1H, or 15m makes the histogram meaningless and will mislead you. 1D minimum, always.
Sigma does not tell you direction on its own. The gold bar means flow fired; pair it with Buy/Sell to read which side, and Cash Volume to read in dollars.
Why it works
You cannot fake real money. The detection is built around footprints that only appear when one side genuinely overpowers the other in actual dollars. Not retail churn, not market-maker noise, not wash trading. Those footprints are rare on most days for most coins. When they cluster, someone is doing something deliberate. Sigma turns that signal into a single number you can scan in half a second.
Examples
Case A: accumulation before a pump
- Setup.
- A coin had been ranging for many days with no news.
- Signal.
- Several consecutive daily sigma bars turned gold (raw counts above the coin’s alpha).
- Outcome.
- A breakout followed; the prior gold cluster marked the staging zone.
- Lesson.
- Gold clustering inside a range is the cleanest accumulation tell sigma offers.
Case B: failed breakout (no flow)
- Setup.
- A coin broke a key level on visibly increased volume.
- Signal.
- Sigma stayed gray on the breakout day.
- Outcome.
- Price reverted within days.
- Lesson.
- Volume without one-sidedness is not flow. Breakouts without sigma have no fuel.
Case C: zone as resistance after a downside break
- Setup.
- A gold zone printed at a price band during a downtrend.
- Signal.
- Price rallied back to that zone weeks later.
- Outcome.
- Rally rejected at the zone.
- Lesson.
- Zones mark where the dominant side committed real money. Returning to them invites the opposite reaction.
Case D: distribution at the top
- Setup.
- A coin had run up significantly over many days.
- Signal.
- Two consecutive gold sigma days printed into the run-up.
- Outcome.
- Top printed within days.
- Lesson.
- Gold after a long run is usually exit liquidity for someone, not entry.